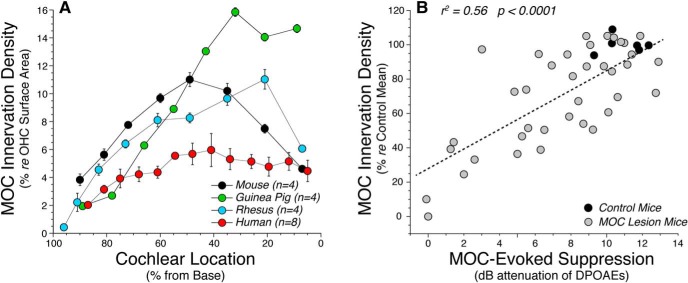
Figure 9.
Quantification of MOC terminal area relative to OHC surface area in each of four species. A, The human data are from the middle-aged group in Figure 5, expressed relative to OHC surface areas extracted from the myosin-immunostaining channel in the same image stacks. Mouse, guinea pig, and rhesus data are from four ears in each species, immunostained, imaged, and analyzed exactly as for the human data and similarly expressed relative to the OHC surface areas extracted from the same set of image stacks. B, To demonstrate the functional validity of the MOC silhouette area metric, we reanalyzed image stacks from a prior study in which MOC feedback strength was measured after partial sectioning of the MOC bundle (Liberman et al., 2014). Each point represents a different case, comparing shock-evoked MOC suppression at the frequency region of maximal effect (22.6 kHz) with the MOC silhouette area in the appropriate cochlear region. The correlation was highly significant (p < 0.001).

