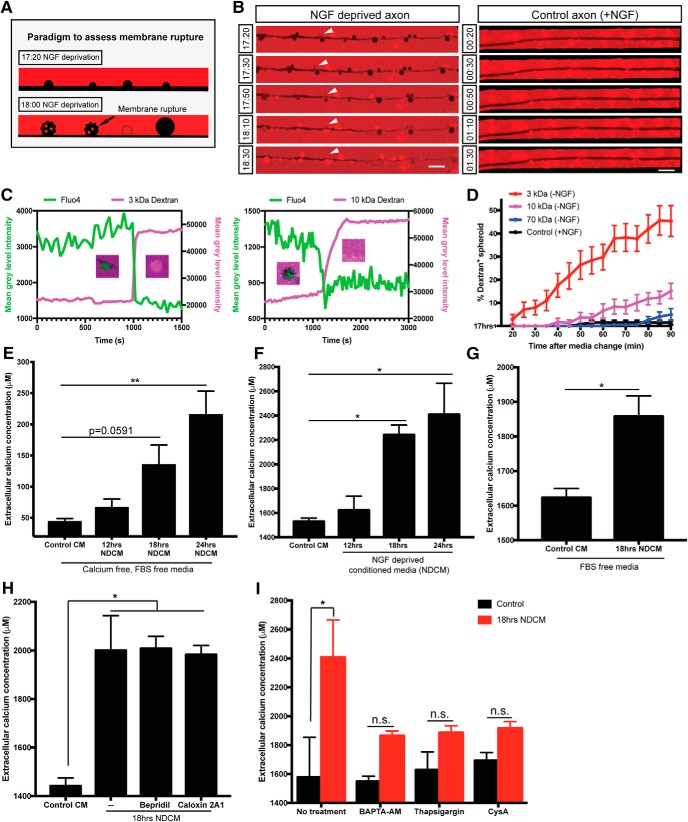
Figure 3.
Axonal spheroids develop membrane rupture after NGF deprivation. A, Schematic representation of the experimental paradigm to assess membrane rupture model using fluorescent dextran. At 17 h 20 min of NGF deprivation, fluorescent dextran (red) is not taken up by the axon (black, negative space). However, by 18 h of NGF deprivation, as the plasma membrane loses integrity and ruptures, fluorescent dextran (red) can diffuse into spheroids, turning them red. Spheroids with intact membrane remain black. B, Representative images of dextran 3 kDa (red) entry to axonal spheroids (black) from 17 h 20 min to 18 h 30 min of NGF deprivation (left column), and dextran exclusion in untreated axons (right column). White arrowheads indicate that dextran 3 kDa enters axonal spheroids after 18 h of NGF deprivation. C, Examples of individual spheroidal tracing on NGF-deprived axons labeled with Fluo4-AM and bathed in 3 kDa (left) and 10 kDa (right) dextrans, respectively. Right, y axis indicates the mean gray level intensity of dextran fluorescence (magenta) after background subtraction. Left, y axis indicates the mean gray level intensity of Fluo4-AM (green) after background subtraction. Spheroids showing the red/green transition are captured. D, Quantification of the percentages of fluorescent 3 kDa (red), 10 kDa (magenta), and 70 kDa (blue) dextran-positive spheroids 20–90 min after 17 h NGF deprivation. Black line (control) indicates the percentages of fluorescent 3 kDa dextran-positive spheroids in the presence of NGF. Total number of n = 15 (3 kDa), n = 15 (10 kDa), n = 12 (70 kDa), and n = 9 (control) axons from three independent litters were counted. E, Measurement of extracellular calcium expelled from axons into calcium-free, FBS-free media. All axons were grown in regular DMEM and then switched to calcium-free, FBS-free media before NGF deprivation. In the Control CM group, media were collected from axons grown in the presence of NGF. In NDCM groups, media were collected at 12, 18, and 24 h after NGF deprivation. Values were analyzed from n = 7 (Control CM), n = 5 (12 h NDCM), n = 6 (18 h NDCM), and n = 7 (24 h NDCM) independent replicates. Compared with Control CM, p = 0.0591 for 18 h NDCM, p = 0.0003 for 24 h NDCM (one-way ANOVA with Dunnett's multiple-comparisons test). F, Measurement of extracellular calcium concentration of untreated and NGF-deprived conditioned media. Values were analyzed from n = 7 (Control CM), n = 4 (12 h NDCM), n = 6 (18 h NDCM), and n = 8 (24 h NDCM) independent replicates. Compared with Control CM, p = 0.0227 for 18 h NDCM, p = 0.0026 for 24 h NDCM (one-way ANOVA with Dunnett's multiple-comparisons test). G, Measurement of extracellular calcium extruded from axons into FBS-free, IS21 supplemented DMEM with or without 18 h of NGF deprivation. All axons were grown in FBS-free, IS21 supplemented media before NGF deprivation. n = 8 (Control CM) and n = 3 (18 h NDCM) independent replicates (p = 0.0022, unpaired t test). H, Measurement of extracellular calcium concentrations in Control CM and 18 h NDCM in the absence and presence of NCX blocker 10 μm Bepridril or PMCA blocker 0.5 mm Caloxin 2A1. n = 4 for Control CM (p=0.0038); n = 4 for 18 h NDCM); − (p = 0.0058); n = 3 for 18 h NDCM, Bepridril (p = 0.0079); n = 3 for 18 h NDCM, Caloxin 2A1 (one-way ANOVA with Tukey's multiple-comparisons test). I, Measurement of extracellular calcium concentration of untreated and NGF-deprived conditioned media in the presence and absence of intracellular calcium chelator BAPTA-AM (10 μm, 1 h incubation before NGF deprivation), SERCA inhibitor thapsigargin (100 nm, overnight treatment before NGF deprivation), and mitochondrial mPTP blocker cyclosporin A (20 μm, 1 h treatment before NGF deprivation). n = 3 for each group. p = 0.0375 for No treatment; p = 0.7952 for BAPTA-AM; p = 0.8897 for thapsigargin; p = 0.9863 for CysA (two-way ANOVA with Sidak's multiple-comparisons test). Data are mean ± SEM. *p < 0.05, **p < 0.001. Scale bar, 10 μm.

