Figure 1.
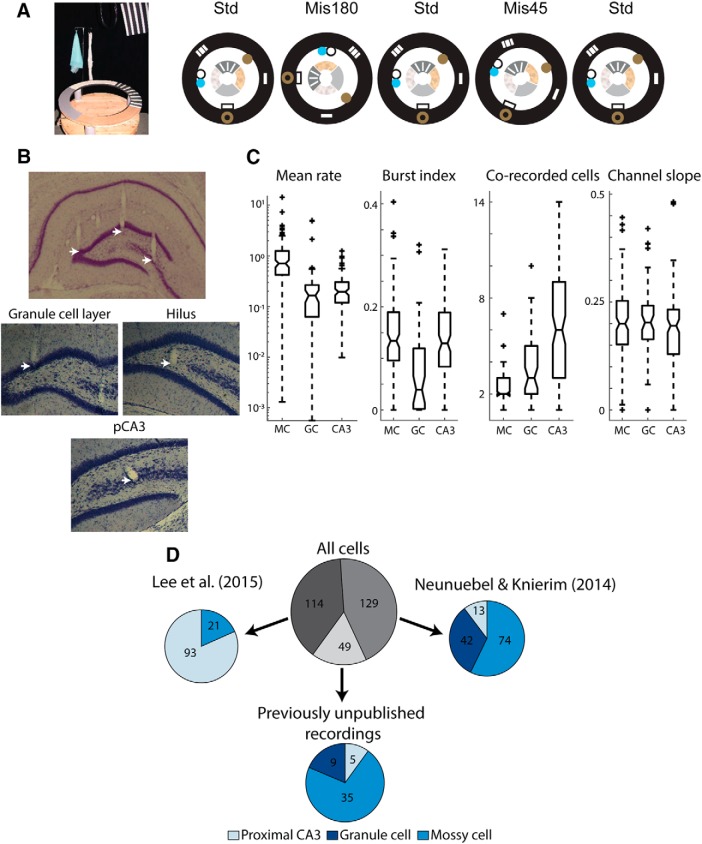
Double rotation task and cell classification. A, Left, The double rotation track. Right, Schematic of an example double rotation recording day. B, Nissl-stained brain sections showing tetrode tracks. Mossy cells can be recorded on tetrodes located throughout the DG and pCA3. Top, An example section showing tetrodes located in the granule cell layer, hilus, and pCA3 pyramidal cell layer (white arrows, left to right, respectively). Bottom, High-magnification images of Nissl-stained sections, showing tetrodes ending in the granule cell layer, hilus, and pCA3 cell layer. C, Firing properties used for cell type classification. Box plots represent the distributions (from left to right) of the mean firing rate (log scale), burst index, number of cells recorded on the same tetrode, and channel slope for classified mossy cells (MC), granule cells (GC), and pCA3 cells (CA3). For each plot, dashed line indicates the range of data (except for outliers, denoted by + signs). Horizontal lines indicate the median, 25th percentile, and 75th percentile. Notches indicate the 95% CI of the median. D, Source and classification of all 292 cells analyzed. From Neunuebel and Knierim (2014), 74 cells were classified as mossy cells, 42 were classified as granule cells, and 13 were classified as pCA3 cells. From Lee et al. (2015), 93 cells were classified as pCA3 cells and 21 were classified as mossy cells. An additional 49 cells that were not previously analyzed were also classified and analyzed here. Of these 49 cells, 35 were classified as mossy cells, 5 were classified as pCA3 cells, and 9 were classified as granule cells.

