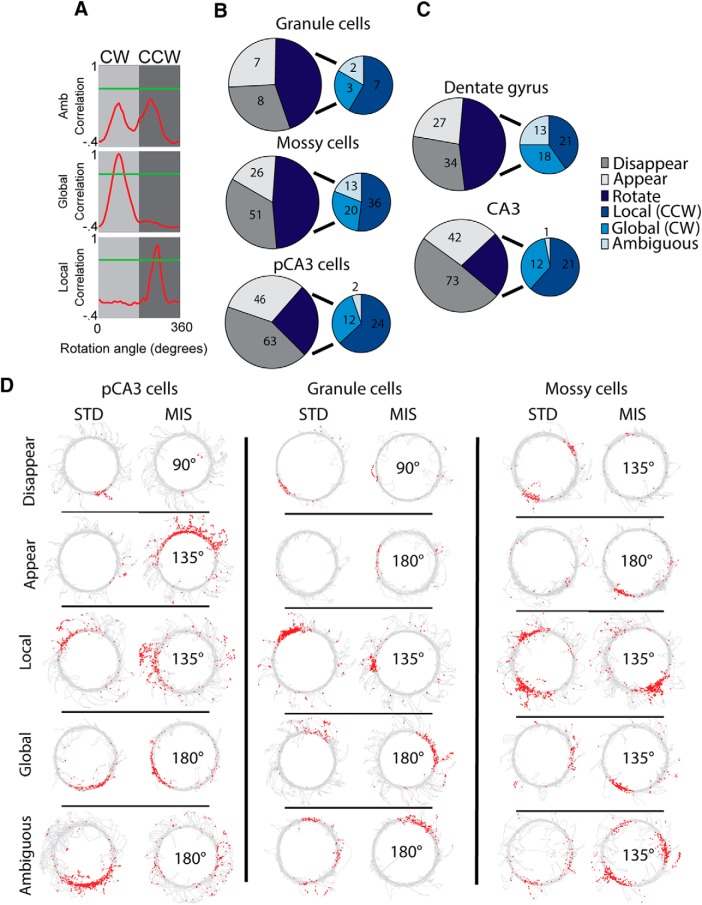
Figure 2.
Rotation and remapping of individual cells. A, For cells that met place-field criteria for both STD and MIS sessions, rate map correlations were calculated as one of the rate maps was rotated in 5° increments. The correlation value is plotted against the angle of rate map rotation. Green line indicates a correlation threshold of 0.6. Following Neunuebel et al. (2013), any cell that did not pass this threshold for any rotation angle was considered to be an ambiguous rotation (top). Remaining rotate cells were classified as clockwise rotations (middle, rotation with global cues) or counterclockwise rotation (bottom, rotation with local cues) based on the direction of rotation that generated the peak correlation. B, C, Number of cells that rotated or remapped following cue rotation. Cells that were active in only the MIS session (appear) or only the STD session (disappear) were designated as remapping cells. Rotating cells were further divided into counterclockwise (CCW), clockwise (CW), or ambiguous rotations as described in A. Only cue rotations > 45° are included in these plots. B, Results from classified granule cells, mossy cells, and pCA3 cells. C, Results from all cells on anatomically localized DG and pCA3 tetrodes (before separation of mossy cells). D, Example recording sessions. One example of each of the different response types is shown for each cell type. For each cell, a pair of consecutive sessions (STD, MIS) is shown. The mismatch angle is indicated in the center of the MIS session plot. Each plot represents the trajectory of the rat in gray. Red dots represent the location of individual spikes of the cell.

