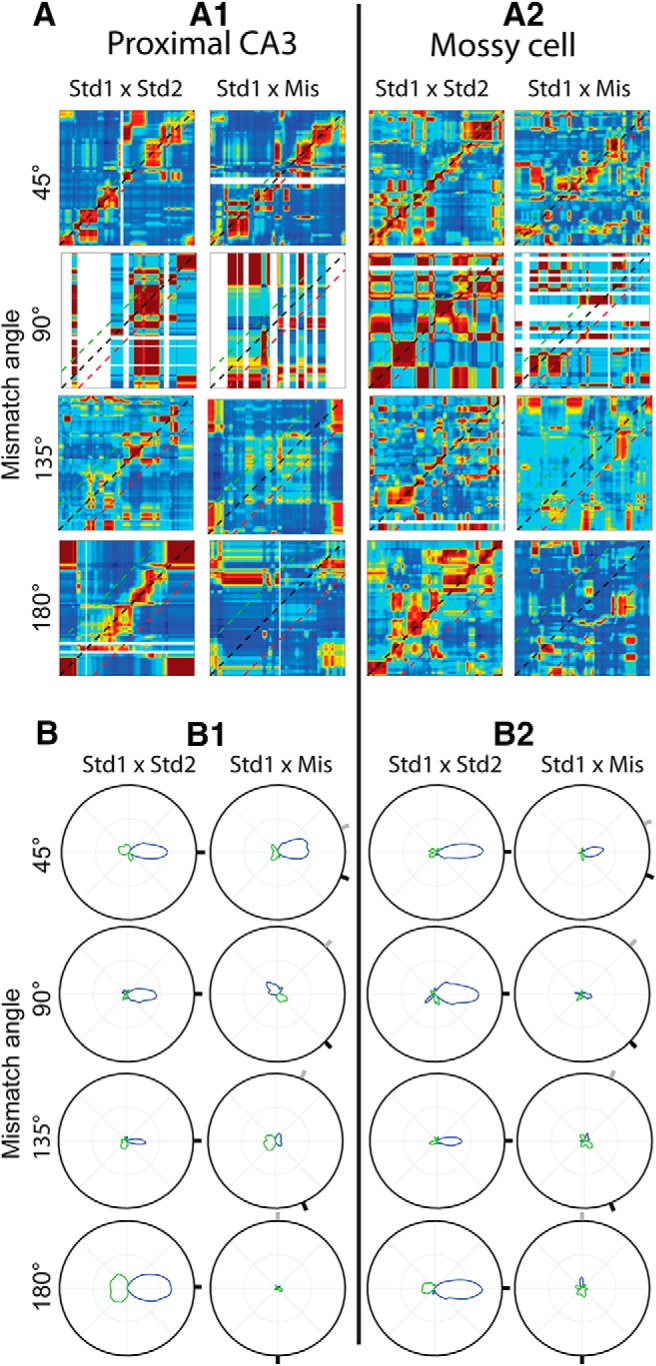
Figure 4.

Responses of downsampled pCA3 and mossy cell populations to cue rotation. A, Correlation matrices of downsampled pCA3 cell (left) and mossy cell (right) populations (plotted as in Fig. 3A). Correlation matrices were generated using the same number of cells used to generate the corresponding granule cell plots (Fig. 3A3). B, Polar plots of correlation matrices in A (plotted as in Fig. 3B).
