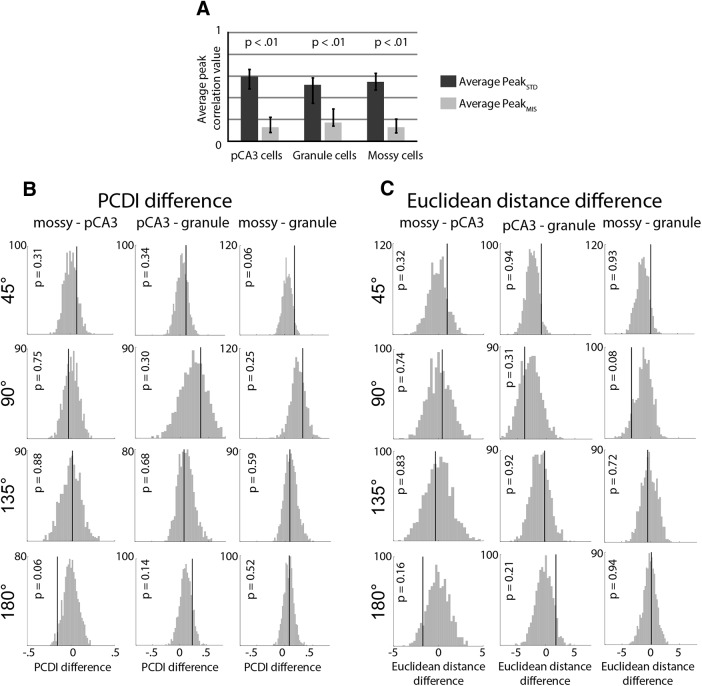
Figure 5.
Comparison of population responses. A, The highest average correlation band value (peak value on the polar plot) was calculated for each correlation matrix. The average of this value for the 135° and 180° rotation angles was calculated for each cell type in the STD and MIS matrices (one value for each column in Fig. 3B; for more detail, see Materials and Methods). The average of the 135° and 180° value is plotted here, and a bootstrapping procedure was used to determine 95% CIs (black bars). p values for the difference between the STD and MIS correlation values were defined as the number of bootstrap samples in which the average PeakSTD value was less than the average PeakMIS value. In all three cell types, the correlation was significantly higher between STD sessions than between STD and MIS sessions. B, PCDI difference values. The PCDI value was calculated for each cell type and rotation angle, and the difference was calculated between each pair of cell types. The actual difference value (black line) was compared with the values obtained by a shuffling procedure, and the p value was defined as the number of times that the absolute value of the shuffled value exceeded the observed value. There were no significant differences between any cell types for any rotation angles. C, Same as in B, but using the Euclidean distance measurement (Lee et al., 2015).

