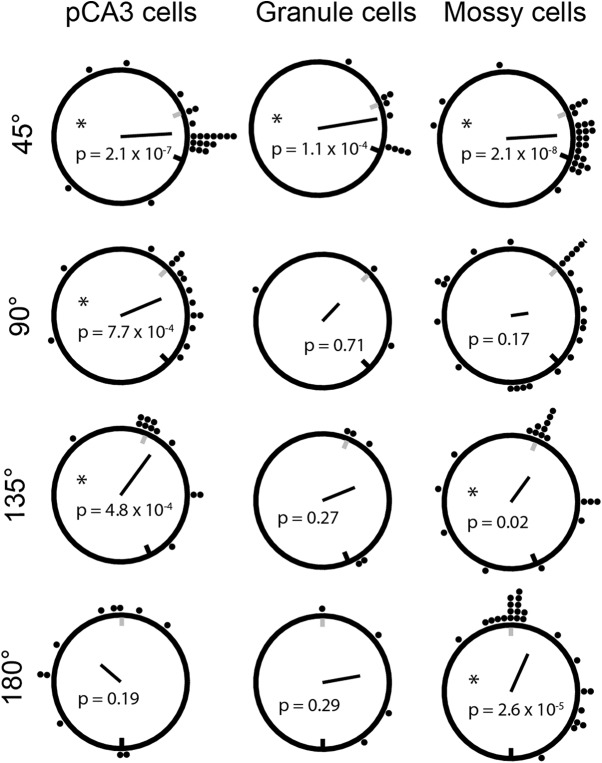
Figure 6.
Peak rotation amount of individual cells that passed activity criteria in both STD and MIS sessions under comparison (remapping cells were not analyzed here). As in Figure 2, correlations between STD and MIS rate maps were calculated following 5° shifts of one rate map. Each black dot represents one “rotate” cell (as defined for Fig. 2). The location of the dot represents the rotation angle that generated the peak correlation value. Black line indicates the direction and magnitude of the mean vector of the distribution of rotation angles (the black unit circle is provided for scale), and p values are results of Rayleigh tests (asterisks mark significant results). Gray and black tick marks along the black circle represent the rotation angle of the local and global cues, respectively. All three cell types reach significance following the 45° rotation. At larger rotation angles, there is an overrepresentation of the rotation amount that corresponds to the counterclockwise rotation of the local cues, causing a number of rotation angles to reach significance in the Rayleigh test for mossy cells and pCA3 cells. While granule cells do not have a significant overrepresentation of local cues in larger rotation angles, this difference may be due to the relatively small number of active granule cells per plot. The proportion of cells that rotated within ±10° of the actual local cue rotation amount is not significantly different between any of the cell types.

