Figure 7.

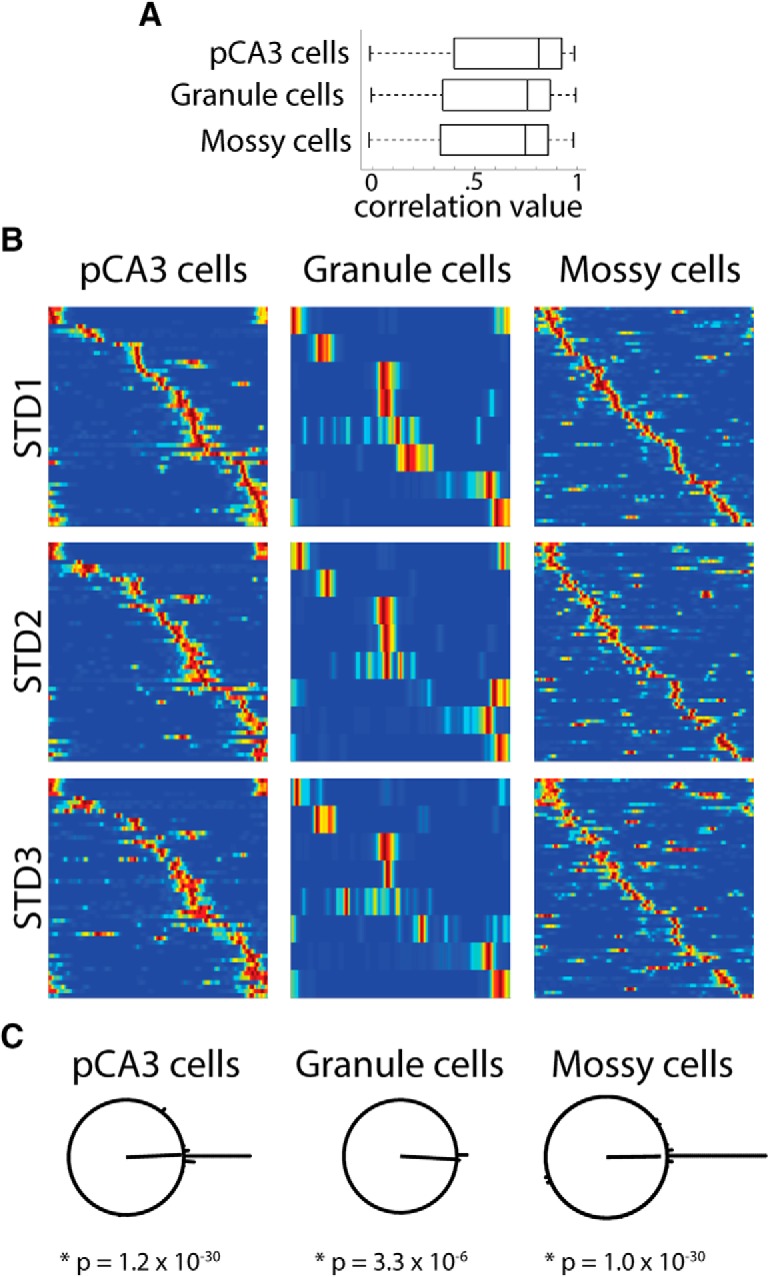
Stable firing in repeated standard sessions. A, Correlation between the first STD session (STD1) and third STD session (STD3) linear rate maps for all cells that were active in at least one STD session. Box plots of the correlation values for pCA3 cells, granule cells, and mossy cells are shown. There were no significant differences between the distributions of correlation values for any of these cell types. B, The subset of cells that were active in all three standard sessions is plotted for pCA3 cells, granule cells, and mossy cells. The firing of each cell is ordered based on the location of its peak firing along the track in STD1, and that cell order is preserved for in the plots for STD2 and STD3. For all three cell types, the relative firing positions are preserved through all three STD sessions. Mossy cells have more firing outside of the main place field (i.e., firing away from the diagonal band), as expected based on the high activity and multiple place fields of mossy cells. C, As in Figure 6, the peak rotation angle was calculated between STD1 and STD3 for each cell type. The majority of cells in all areas have a peak rotation angle of 0° (44 of 48 pCA3 cells, 8 of 9 granule cells, and 50 of 57 mossy cells had a peak rotation amount within 10° of a 0° rotation).
