
Figure 5.
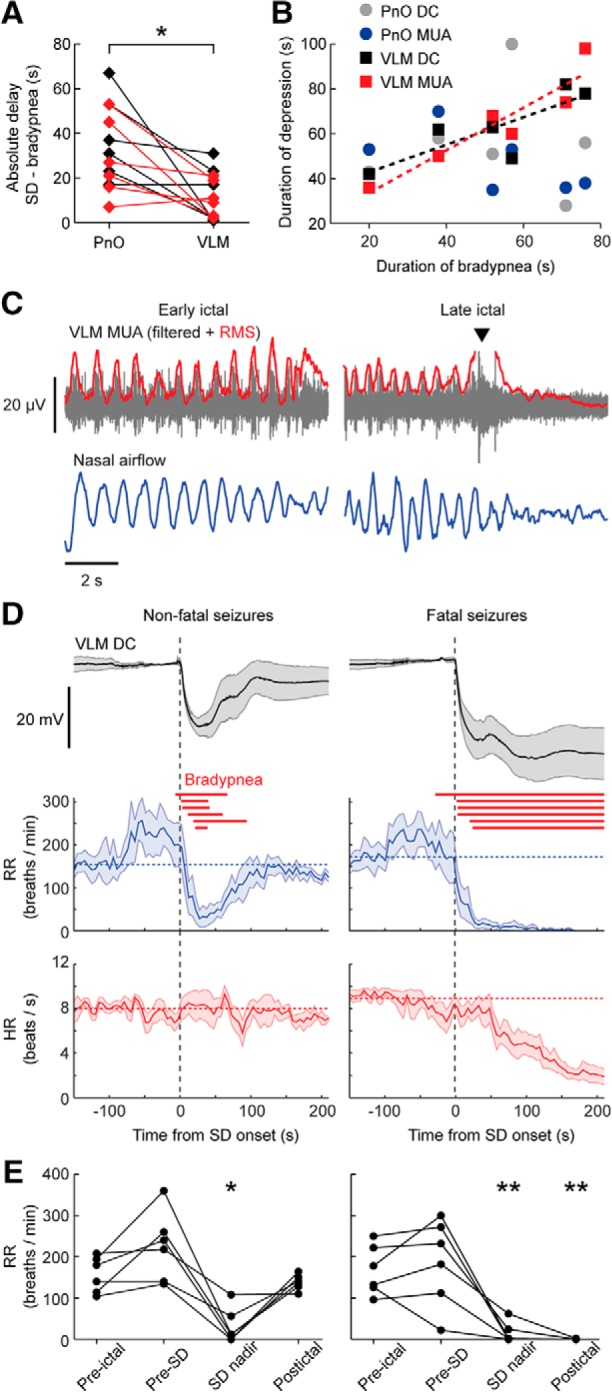
SD in the VLM is strongly correlated with seizure-related respiratory suppression in Cacna1aS218L mice. A, Absolute time delay between onset of bradypnea and SD in the PnO and VLM for nonfatal (red; n = 6) and fatal (black; n = 6) seizures, showing that VLM SD occurred significantly closer to onset of bradypnea (t(11) = 3.64, *p = 0.004, paired t test). B, Duration of brainstem DC and MUA depression plotted against duration of bradypnea. Significant correlation was observed only for VLM DC and MUA (dashed lines; R2 = 0.671, p = 0.046 and R2 = 0.873, p = 0.006, respectively, linear regression). C, Disruption of phase-coupled MUA in the ventrolateral medulla and breathing during a fatal seizure. In this example, VLM MUA was phase-coupled with nasal airflow. Local MUA (RMS, Root mean square) peaked during onset of VLM SD (arrowhead), followed by suppression which coincided with cessation of breathing activity. D, VLM DC-potential, respiratory rate (RR) and heart rate (HR) synchronized at onset of nonfatal (left) and fatal (right) VLM SD (at time = 0 s). Red lines indicate bradypnea duration for single cases. Horizontal dashed lines indicate RR and HR during a 60 s pre-ictal period. E, RR was significantly suppressed during SD nadir, but only for fatal seizures suppression continued into the post-ictal period (30 s after behavioral arrest; *p = 0.002, **p < 0.001, ANOVA with Dunnett's test).