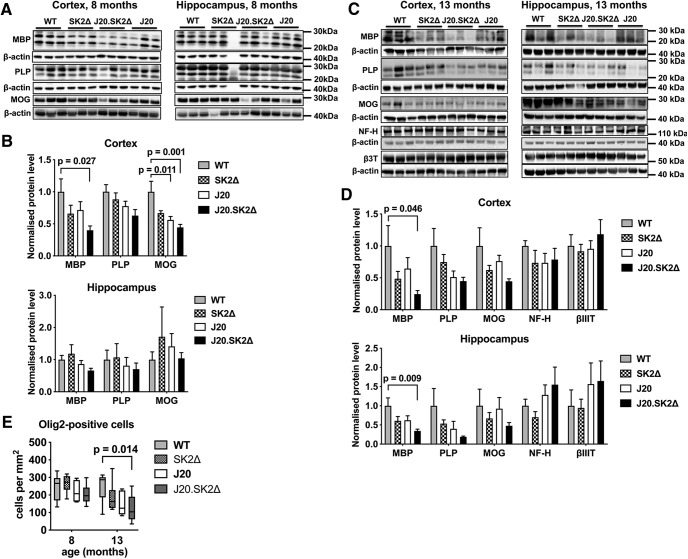
Figure 6.
Loss of myelin markers and reduced oligodendrocyte density in J20.SK2Δ mice. Western blots (A, C) and densitometric quantification (B, D) of myelin and neuronal markers in cortex and hippocampus of 8-month-old (A, B) and 13-month-old (C, D) mice. Protein levels were normalized to β-actin in each sample, then to the mean of the control group. Graphs show mean ± SEM; n = 5–6 mice per genotype. Statistical significance was determined by one-way ANOVA with Sidak's post-test. E, Olig2-positive cell density in the hippocampus (mean ± SEM; n = 5–6). Statistical significance was determined by two-way ANOVA with Dunnett's post-test. P values for comparisons that were significant in post-tests (p < 0.05) are shown on the graphs.

