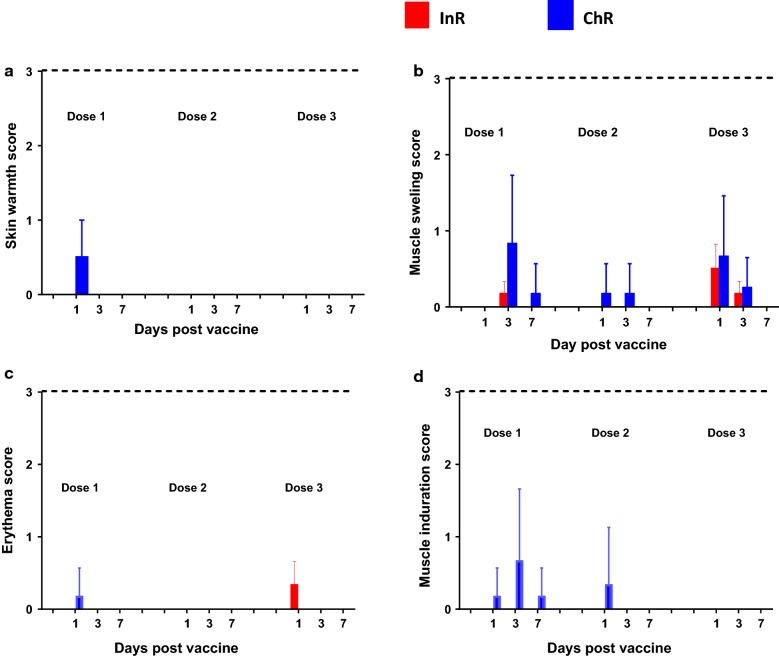
Fig. 1.
Local reactogenicity: All local adverse effects scored on 0–3 scale at days 1, 3, 7 post vaccination (x-axis). Mean + SEM score for local adverse events (n = 6); dotted line represents max possible score. Bars were omitted if no reaction was observed. a Skin warmth, b muscle swelling, c erythema, d muscle induration. No group mean score was significantly above 0

