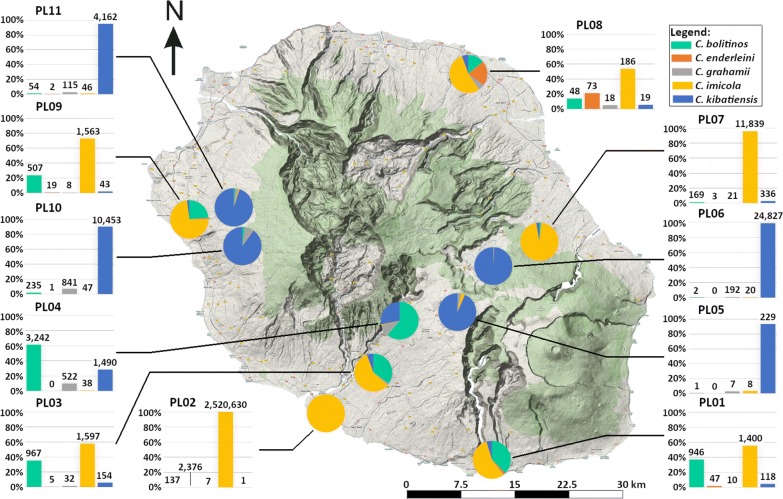
Fig. 2.
Diversity and total abundance at the study sites. Pie charts show the relative frequency of each species on site. Observed abundance resulting from 55 trapping sessions per site except for PL04 (49) and PL11 (33). Bar graphs: site number on title, relative frequency on y-axis, number of individuals on bar labels. Topographical map from French National Geographic Institute (BD Topo® IGN; http://professionnels.ign.fr/scan-ign)

