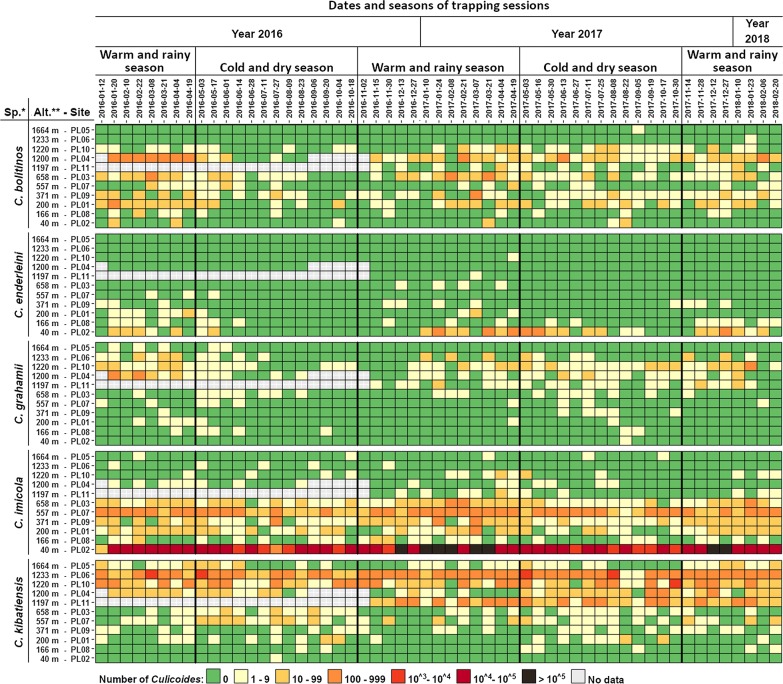
Fig. 3.
Mondrian matrix of fortnightly Culicoides abundance (color coded) of the five species over the two years of trapping collection (January 2016–February 2018) and at the 11 trapping sites. Key: *sp., species; **Alt., altitude in meters. Bold vertical lines separate the seasons. Note that the sites are classified by increasing altitude

