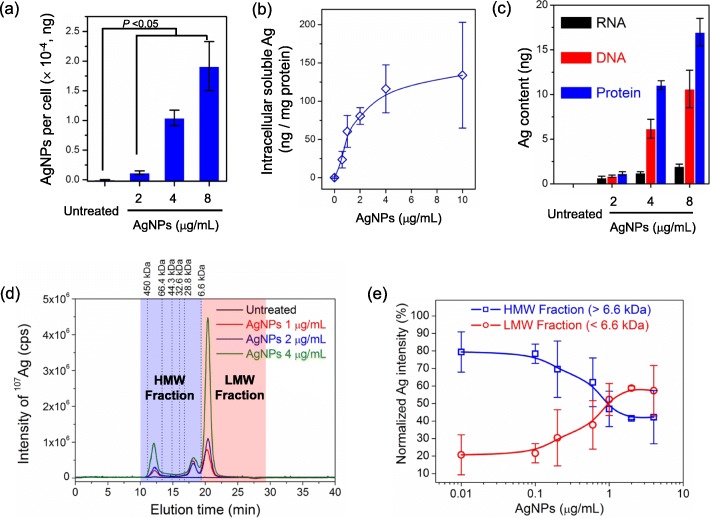
Fig. 4.
Internalization of AgNPs and intracellular soluble Ag-components in AgNPs-treated HepG2 cells. a Cellular delivered dose of AgNPs at 2, 4 or 8 μg/mL after 24 h-treatment (n = 3). b Soluble Ag-components of HepG2 cells treated with AgNPs at 0.6, 1, 2, 4 or 10 μg/mL for 24 h (n = 3). c Ag content of RNA, DNA and protein components in AgNPs-treated HepG2 cells at 2, 4 or 8 μg/mL for 24 h (n = 5). d Chromatograms of Ag-protein complexes from untreated and AgNPs-treated HepG2 cells at 1, 2 or 4 μg/mL for 24 h analyzed using SEC-ICP-MS. e Normalized HMW and LMW fractions from AgNPs-treated HepG2 cells at 0.01, 0.1, 0.2, 0.6, 1, 2 or 4 μg/mL for 24 h analyzed using SEC-ICP-MS (n = 3)

