Fig. 6.
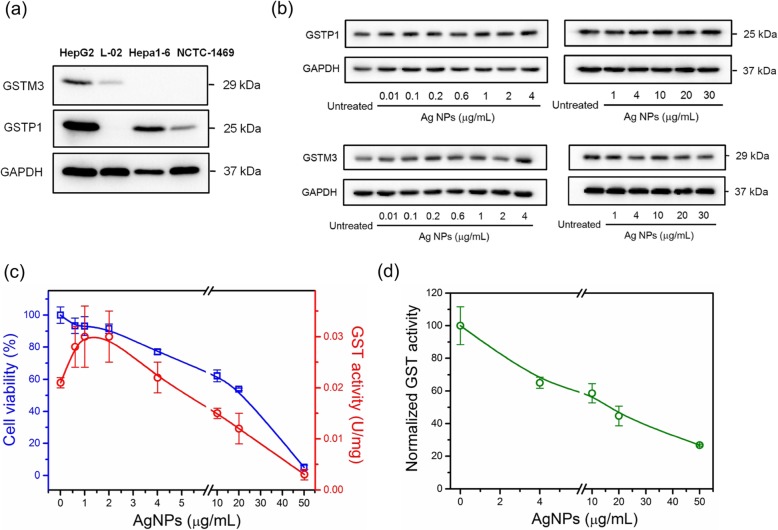
Impact of AgNPs on the expression and enzyme activity of GSTs. a Western blot analysis of GSTP1 and GSTM3 in four hepatic cell lines (NCTC-1469, L-02, Hepa1–6 and HepG2). b Western blot analysis of GSTP1 and GSTM3 in untreated and AgNPs-treated HepG2 cells at 0.01, 0.1, 0.2, 0.6, 1, 2, 4, 10, 20 or 30 μg/mL for 24 h. c Cell viability and intracellular GST enzyme activity of untreated and AgNPs-treated HepG2 cells at 0.6, 1, 2, 4, 10, 20 or 50 μg/mL for 24 h (n = 5). d Depletion of GST enzyme activity by AgNPs under cell-free conditions (n = 3)

