Fig. 8.
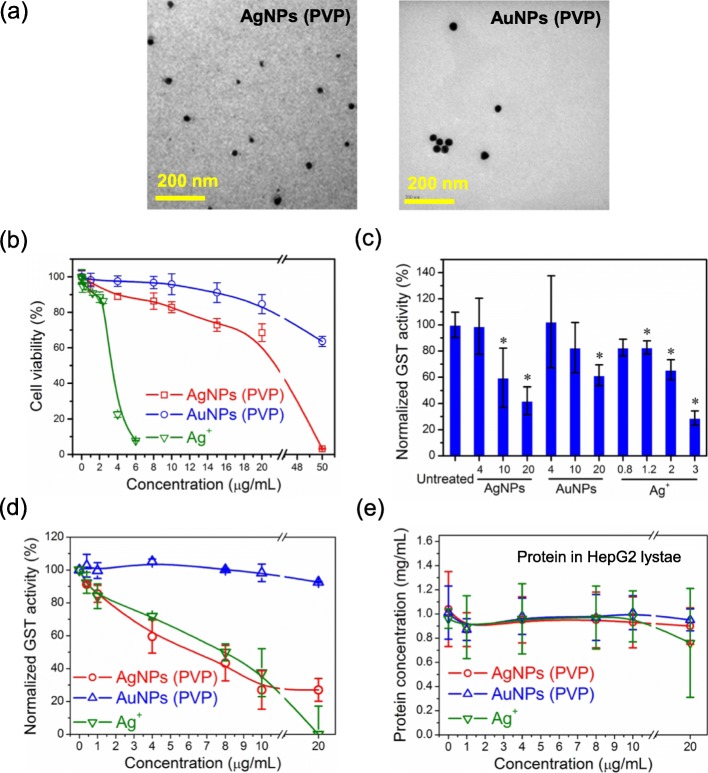
Influence of AgNPs, AuNPs and Ag+ on cytotoxicity and GST activity. a Representative TEM images of AgNPs and AuNPs. b Cell viability of HepG2 cells treated with AgNPs or AuNPs at 1, 4, 8, 10, 15, 20 or 50 μg/mL for 24 h, or Ag+ at 0.04, 0.1, 0.4, 1.2, 2, 2.4 or 4 μg/mL for 24 h (n = 5). c Normalized intracellular GST enzyme activity of HepG2 cells treated with AgNPs or AuNPs at 4, 10 or 20 μg/mL for 24 h, or Ag+ at 0.8, 1.2, 2 or 3 μg/mL for 24 h (n = 4). d Normalized GST enzyme activity and (e) protein concentration in cell lysates after incubation for 1 h at 37 °C with AgNPs, AuNPs or Ag+ at 0.4, 1, 4, 8, 10 or 20 μg/mL (n = 3). Asterisk (*) denotes P < 0.05, compared to untreated cells

