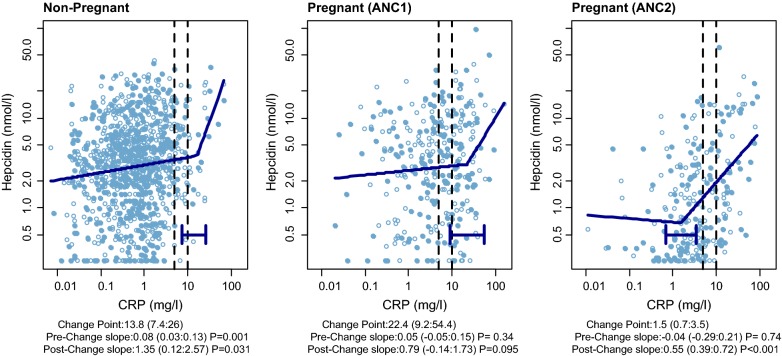
Fig. 3.
Association of maternal serum hepcidin and C-reactive protein concentration at the three assessment time-points in the PALUFER study. The lines show a segmented regression model consisting of linear segments before and after a (fitted) change point, and the different regression slopes before and after this change point with associated 95% CI are shown below the plots. The 95% confidence interval is shown for the change point estimate as a horizontal error bar and numerically below the plot. The vertical stippled lines show the cut points for CRP at 5 mg/l and 10 mg/l. Open and closed symbols indicate iron intervention (closed) and control (open) arms. Serum hepcidin is in nmol/l

