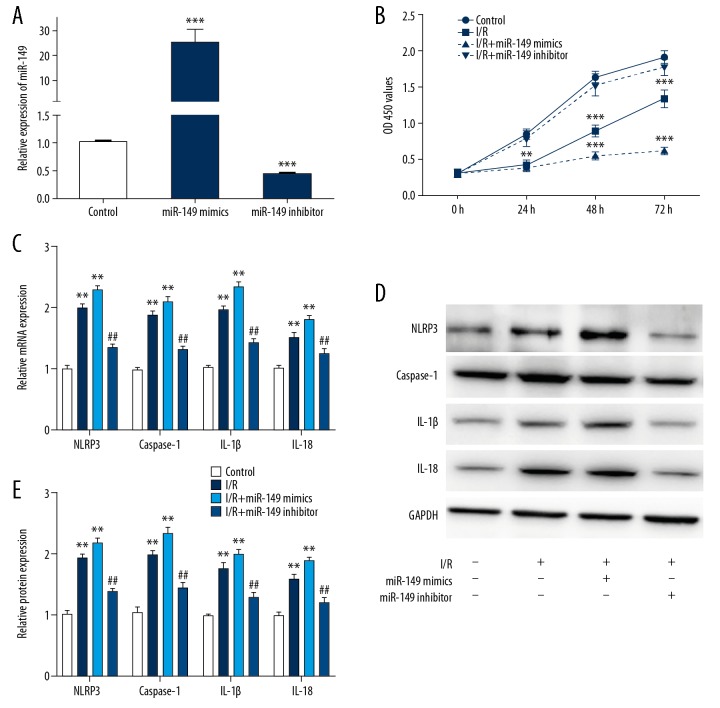
Figure 3.
MiR-149 regulated pyroptosis in I/R-treated H9C2 cells. (A) The expression of miR-149 in cells transfected with miR-149-5p mimics or miR-149-5p inhibitor. (B) CCK-8 assay showing the cell proliferation in H9C2 cells during I/R treatment when transfected with miR-149mimics or miR-149 inhibitor. (C–E) The mRNA and protein levels of NLRP3, caspase-1, IL-1β, and IL-18 were detected by western blotting and RT-PCR in H9C2 cells transfected with miR-149mimics or miR-149 inhibitor. The data are presented as the mean±SD, n=3;** P<0.01 vs. control. ## P<0.01 versus I/R group. NC – negative control; I/R – ischemia/reperfusion; CCK-8 – Cell Counting Kit-8; RT-PCR – real-time polymerase chain reaction; IL – interleukin; SD – standard deviation.

