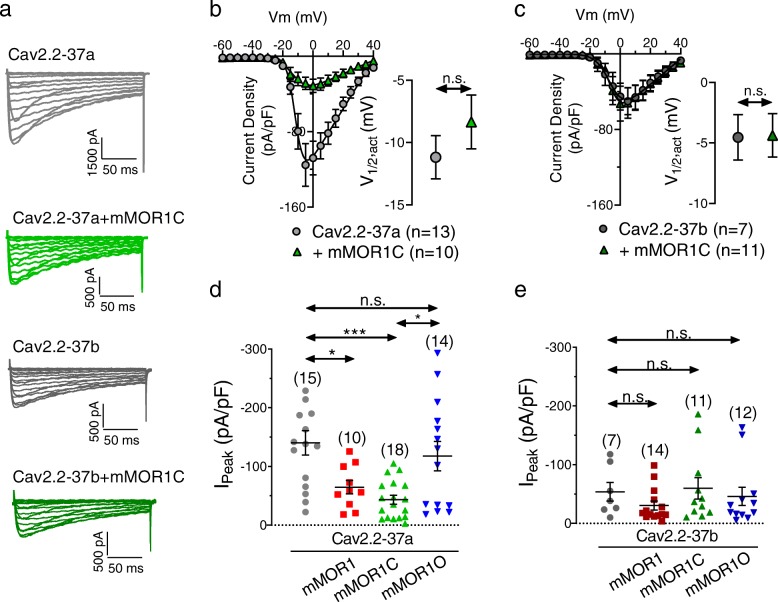
Fig. 2.
Peak current densities (I peak) of Cav2.2e37a and Cav2.2e37b channels coexpressed with mMOR1, mMOR1C or mMOR1O.a Representative whole cell current traces recorded in response to depolarizing steps from − 60 mV to + 40 mV from a holding potential of − 80 mV from tsA-201 cells expressing Cav2.2-37a/Cavβ1/Cavα2δ-1 or Cav2.2-37b /Cavβ1/Cavα2δ-1 channels plus/minus mMOR1C. b Average current density-voltage relationships for cells expressing Cav2.2-37a channels with or without mMOR1C. Inset: Corresponding mean half activation potentials. c Average current density-voltage relationships for cells expressing Cav2.2-37b channels with or without mMOR1C. Inset: Corresponding mean half activation potentials. d Average peak current density for whole cell calcium currents recorded from cells expressing Cav2.2e37a/Cavβ1/Cavα2δ-1 in the presence of mMOR1, mMOR1C and mMOR1O. e Average peak current density recorded from tsA-201 cells expressing Cav2.2e37b/Cavβ1/Cavα2δ-1 in the presence of mMOR1, mMOR1C or mMOR1O. The numbers in parentheses represent the number of cells recorded. n.s. – not significant, asterisks denote significance at the *0.05 and ***0.001 levels (d – ANOVA; e - Kruskal-Wallis test)

