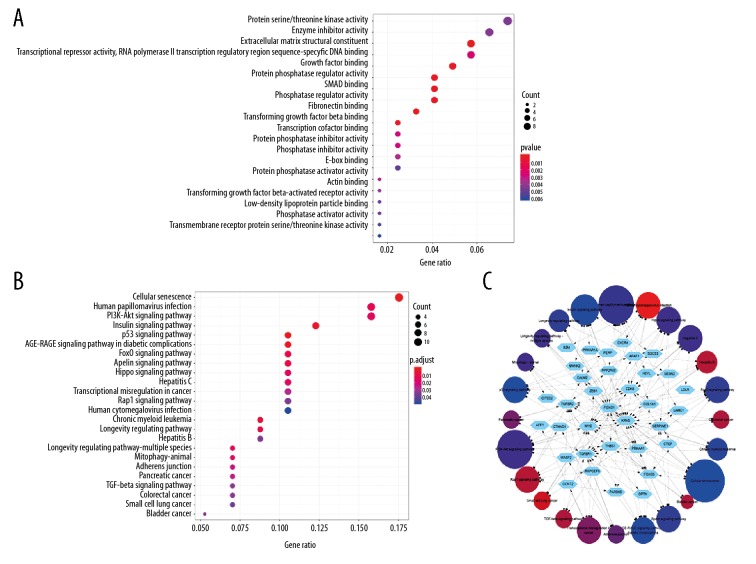
Figure 5.
Functional analysis of 128 DEmi-mRNAs. (A) The dotplot of top 20 GO analysis. (B) The dotplot of KEGG pathway. (C) The network diagram between KEGG pathways and mRNA. The larger the circle, the more genes it contained; conversely, the smaller the circle, the fewer genes it contained. The color of the circle is correlated with the P-value. The smaller the P-value is, the closer it is to the red value. The larger the P-value is, the closer it is to the blue value. DE – differentially expressed; mi – micro; m – messenger; GO – Gene Ontology; KEGG – Kyoto Encyclopedia of Genes and Genomes.

