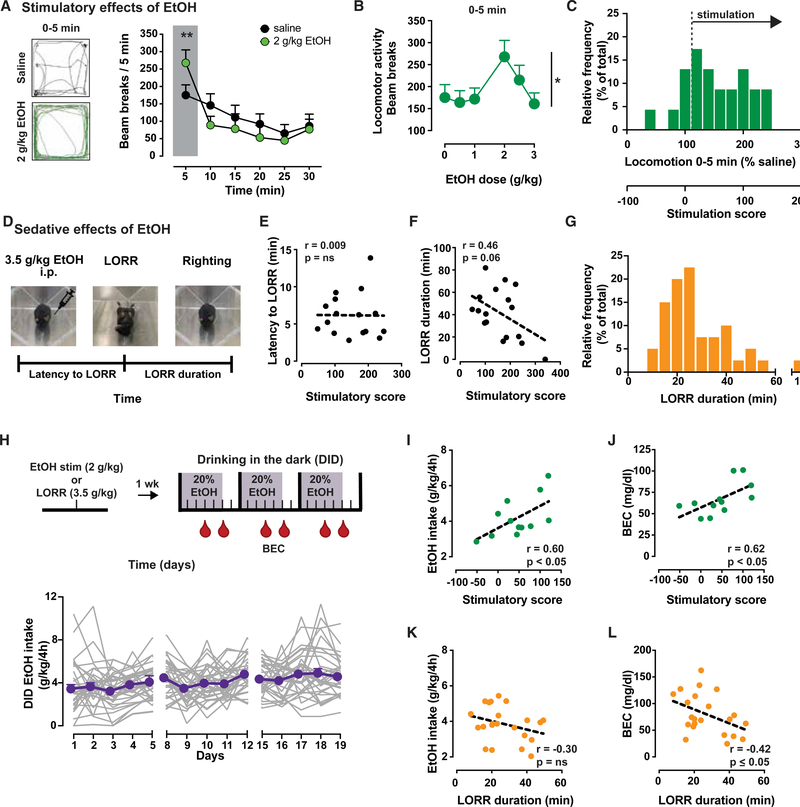
Figure 1. Inbred Mice Show Ethanol Stimulatory and Sedative Effects with Individual Variability Correlating with Intoxication.
A) Left, sample traces of locomotor activity for 5 min following injection of saline (black) or 2 g/kg ethanol (green) in Drd2loxP/loxP mice (n = 23). Right, time course of locomotor activity following saline (black) or 2 g/kg ethanol (green) in Drd2loxP/loxP mice (2-way repeated-measures [RMs] ANOVA: F5,110 = 4.3, p < 0.01). Shaded box highlights ethanol stimulation during first 5 min. **p < 0.01, Bonferroni’s multiple comparison.
(B) Dose-dependent ethanol stimulation plotted as locomotion 5 min after ethanol administration (n = 23; F3.59,78.89 = 2.8; *p < 0.05).
(C) Frequency histogram of individual mouse responses to 2 g/kg ethanol during first 5 min, presented as percentage of activity after saline (top × axis) and as stimulation score (bottom × axis).
(D) Schematic illustrating the loss of righting reflex (LORR) task.
(E and F) No significant correlation between stimulatory scores and latency to LORR (E) (n = 17; Pearson’s r = 0.01, p > 0.05), while an inverse trend is seen between stimulation scores and LORR duration in Drd2loxP/loxP mice (F) (n = 17; Pearson’s r = 0.46, p = 0.06).
(G) Frequency histogram of mouse LORR duration illustrates the range of individual variability.
(H) Top, outline of experimental protocol showing sequence of tests and days (ticks) in which tail blood samples (red drop) were taken and processed for BEC. Bottom, average ethanol intake (purple symbols) of individual mouse data (gray lines; n = 34).
(I and J) The mean individual ethanol intake (I) and BEC (J) achieved during DID show a significant positive correlation with the stimulation score of each mouse (n = 12; Pearson’s r = 0.6 and r = 0.62, respectively; p < 0.05).
(K and L) The mean individual ethanol intake showed no correlation with LORR duration (K) (n = 22; Pearson’s r = −0.42, p ≤ 0.05) but an inverse correlation with mean BEC achieved during DID (L) (Pearson’s r = −0.30, p > 0.05).
All of the symbols with error bars are means ± SEMs; symbols without error bars represent data from individual animals.

