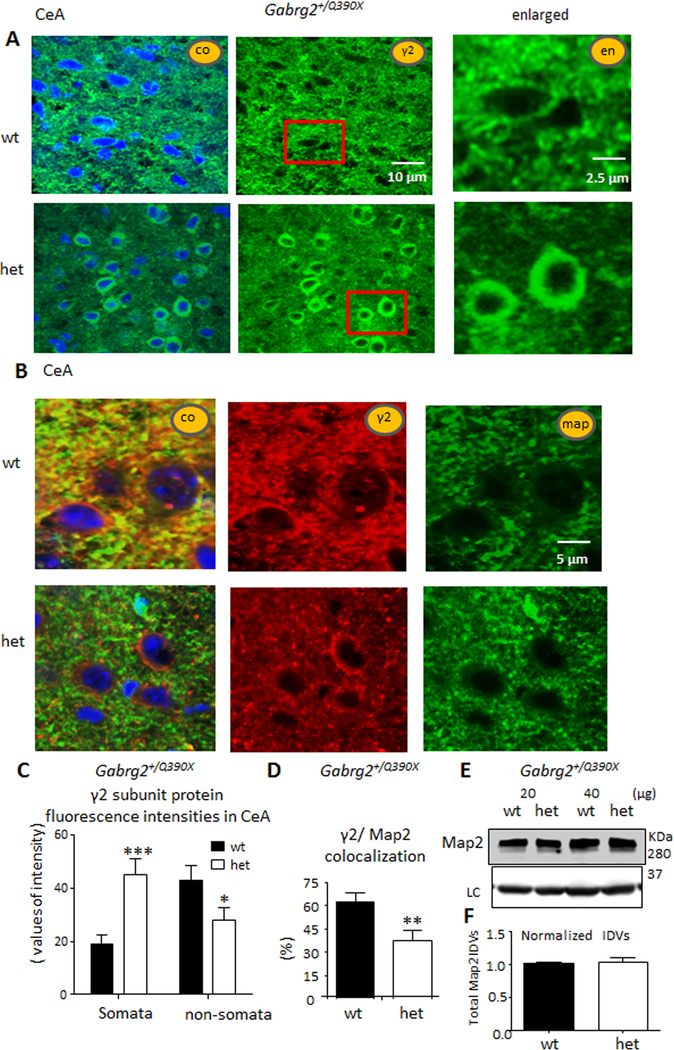
Figure 3. γ2 subunits accumulated in the somata but were depleted in dendrites in CeA in Gabrg2+/Q390X mice.
A, B. Images from CeA regions of brain sections that were stained with rabbit anti-γ2 subunit (green) antibody alone (A), or rabbit anti-γ2 subunit (red) and mouse anti-Map2 (green) antibodies (B). The nuclei were stained with TO-PRO-3.
C. The γ2 subunit fluorescence intensities were analyzed by ImageJ. The γ2 subunit fluorescence signals in somata or non-somata regions in the whole section were measured by subtracting the background value in the nuclei region from the total raw value (n = 28, 28 sections from 4 pairs of mice).
D. γ2 subunit fluorescence puncta colocalized with Map2 in the whole field of each sampled region (n = 15) were measured. The fluorescence signal from the whole section were measured (n = 15, 15 sections from 4 pairs of mice).
E. Total lysates of CeA were analyzed by western blot, and the membranes were immunoblotted with anti-mouse Map2 antibody (upper panel).
F. The normalized integrated density values (IDVs) of Map2 were plotted. The IDVs of Map2 were normalized to its internal control. Data were presented as mean as mean ± S.E.M (*p < 0.05, **p < 0.01, ***p < 0.001 vs wt).

