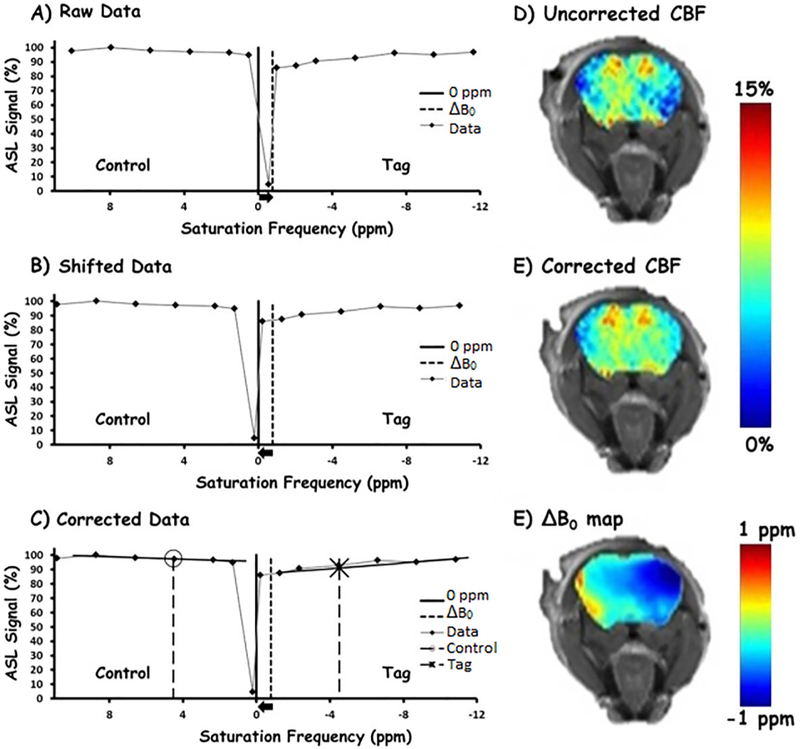
Fig. 3.
Representative TADDZ signals (A) from a pixel plotted against tagging distances (converted to ppm). A −0.8 ppm B0 inhomogeneity is observed from this pixel. Image reconstruction to obtain B0-corrected signals by unshifting according to the B0 inhomogeneity (B) then interpolating signals at intended tagging distance (C). The O and X markers are the signal that was intended to be acquired. The corrected values are determined using linear interpolation (solid black lines) and interpolation. Sample rCBF maps before correction (D) after correction (E) and the corresponding ΔB0 map (F).

