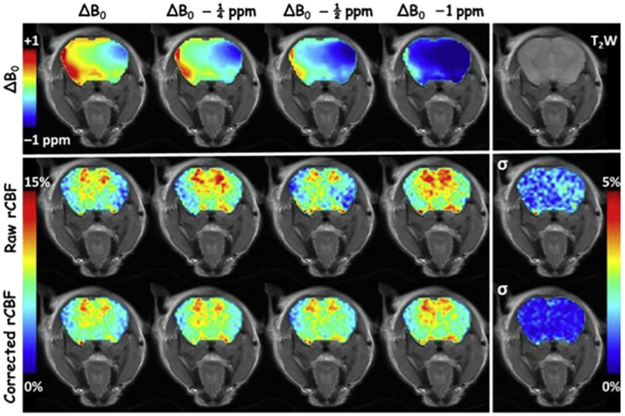
Fig. 4.
Demonstration of TADDZ corrected ASL MRI that corrects B0 inhomogeneity induced artifacts. Top row shows the ΔB0 maps. Middle row shows the uncorrected CBF maps produced from conventional ASL MRI, whereas the bottom row shows the B0-corrected CBF maps from TADDZ MRI. The columns, from left, depict the experiments by manually shifting ΔB0 by 0, 0.25, 0.5, and 1 ppm, respectively. The last column depicts the voxel-wise standard deviation (σ) of the CBF maps within their row. The upper right image is a T2-weighed (T2W) image showing the brain anatomy.

