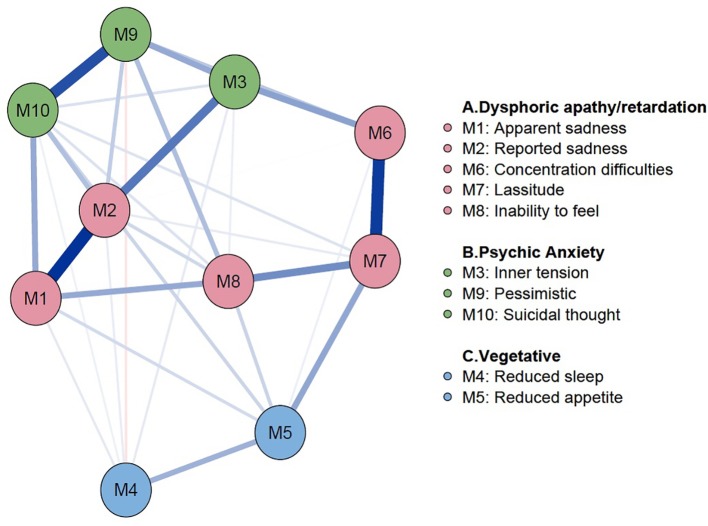
Figure 1.
Baseline network of late-life depression. Network Analysis on 776 patients with late-life depression was performed. The symptoms were connected closely to each other within the known subgroups of the MADRS symptoms. The color of each node represents symptoms in MADRS. Color in node represents the subgroup of each symptoms, color of subgroups are as follows: (A) (red color): Dysphoric apathy/retardation symptom group; (B) (green color): Psychic anxiety symptom group; (C) (blue color): Vegetative symptom group. Edges in blue color represent proportional relationships and edges in red color represent inverse relationships. The magnitude of color represents the degree of the relationship between symptoms. MADRS, Montgomery–Åsberg Depression Rating Scale.

