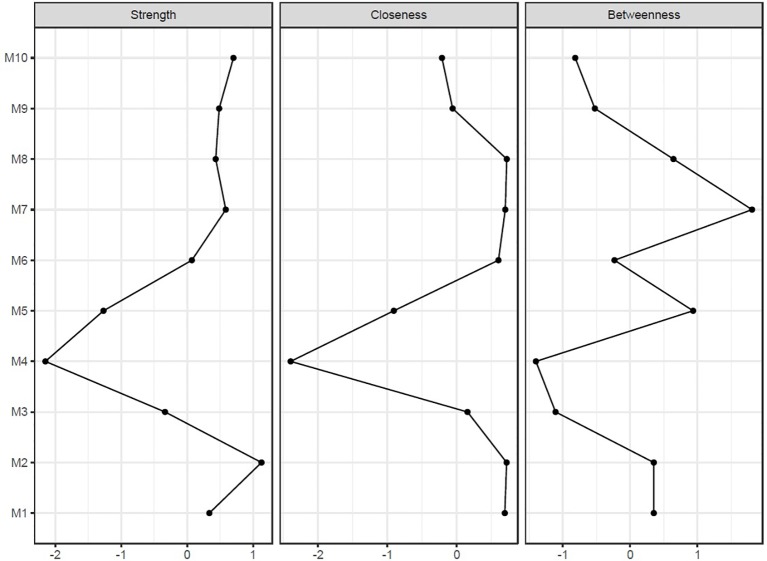
Figure 2.
Centrality indices of baseline network. Horizontal axis represents the raw value of centrality indices which is the degree of involvement of the focal node to other nodes in network. Vertical Axis represent each symptoms of depression. Node strength quantifies how well a node is directly connected to other nodes. Closeness quantifies how well a node is indirectly connected each other. Betweenness quantifies how important a node is in the average path between two other nodes.

