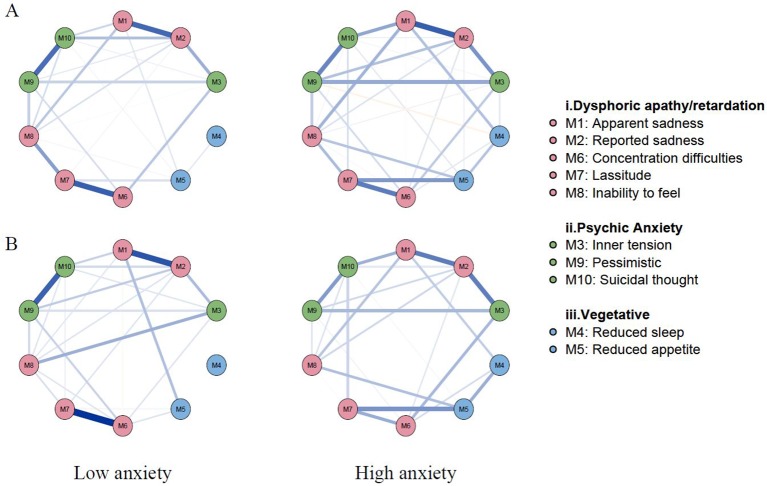
Figure 4.
Network structures with low vs high anxiety before and after propensity score matching. (A) Network structures before propensity score matching; (B) Network structures after propensity score matching. Overall connectivity was increased in the high anxiety group before propensity score matching. Remarkable changes in the high anxiety group are newly formed edges between lassitude [M7]— suicidal thought [M10] and apparent sadness [M1] —reduced sleep [M4]. Edges in blue color represent proportional relationships and edges in red color represent inverse relationships. The magnitude of color represents the degree of the relationship between symptoms.

