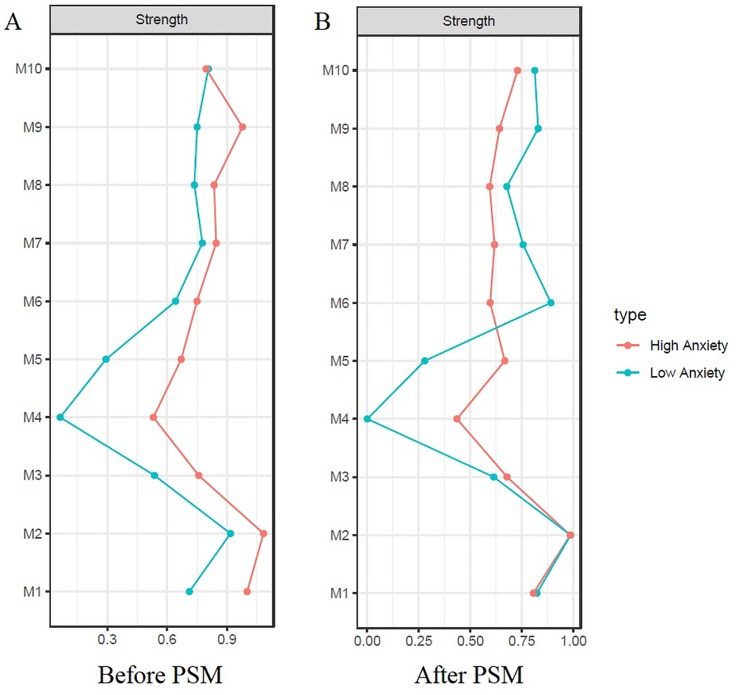
Figure 5.
Centrality indices (strength) of low vs high anxiety before and after propensity Score matching. (A) Before propensity score matching; (B) After propensity score matching. Remarkably higher node strength is observed in all nodes except suicidal thought [M10] in the network before PSM (A). After PSM, such order was reversed except for the centrality indices of inner tension [M3] and vegetative symptoms (reduced sleep [M4] and reduced appetite [M5]) (B). The horizontal axis represents node strength which is the degree of connection of a node to all other nodes in network. The vertical Axis represent each symptoms of depression.

