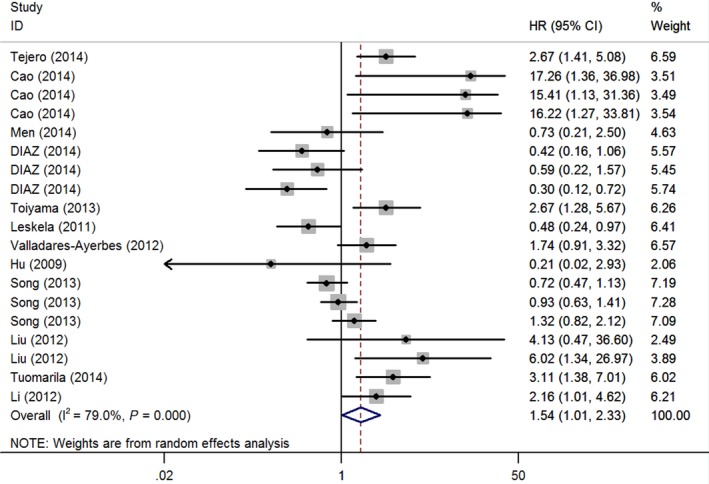
Figure 2.

Forest plots of total analyses for patient survival associated with miR‐200 family expression. The squares and horizontal lines correspond to study‐specific hazard ratio (HR) and 95% confidence interval (CI). The area of the squares reflects the weight. The diamond represents HR and 95% CI
