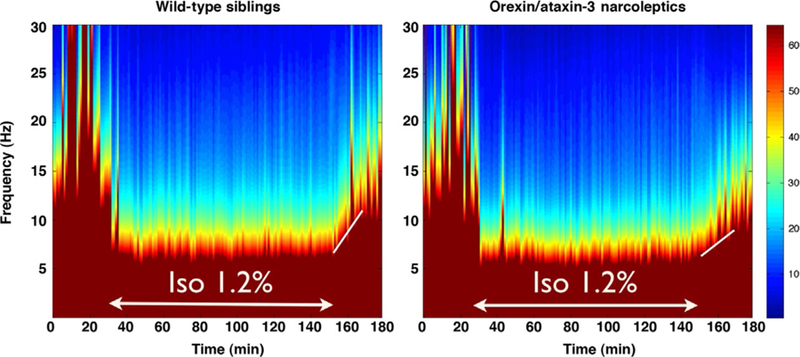
Fig. 3.

Spectral analysis of murine EEG shows delayed emergence in narcoleptic orexin/ ataxin-3 mice. Compared to their wild-type siblings (n=4, left), narcoleptic orexin/ ataxin-3 (n=4, right) shows similar baseline spectral power in the 30min prior to a 2-h 1.2% isoflurane exposure, a similar decrease in higher frequency power during the isoflurane anesthetic, but a delayed return of power in the 30min after isoflurane is discontinued. Note the shallower slope of the white line in the narcoleptic mice to the right.
