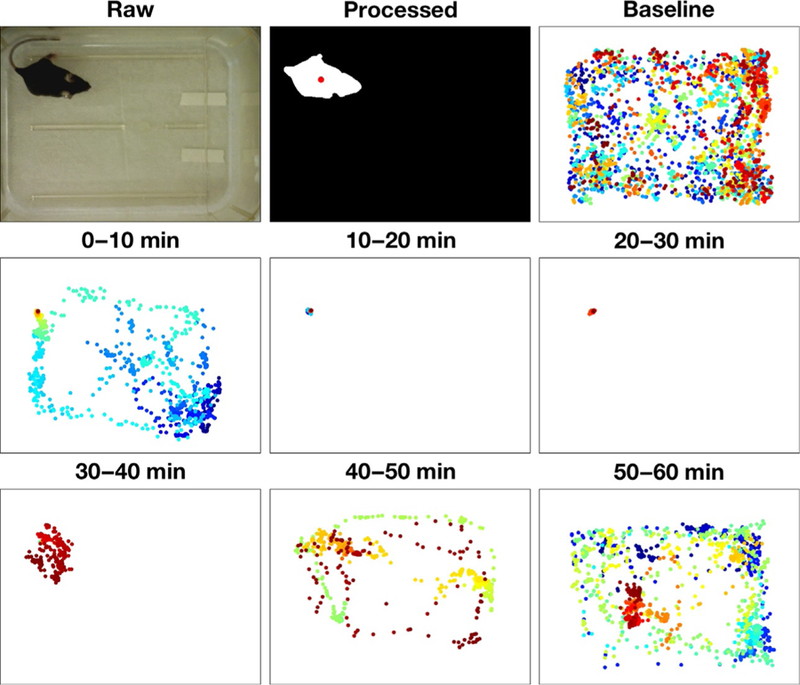
Fig. 4.

Video tracking of movement reveals duration of anesthetic sedation. Using the mouse tracking methodology described, a representative experimental paradigm is seen in this figure for a 100mg/kg IP injection of propofol for a single mouse. Video was captured at 5fps and was digitally processed to highlight the body of the mouse, with the central point of the mouse being featured in the processed image. Ten minutes epochs are shown for baseline activity, where no drug intervention is present, and for each subsequent 10min epoch following the 100mg/kg IP propofol injection up to 60min after injection. Every point represents a single frame from the video, where time within each epoch is represented by color (0min=Blue → 10min=red).
