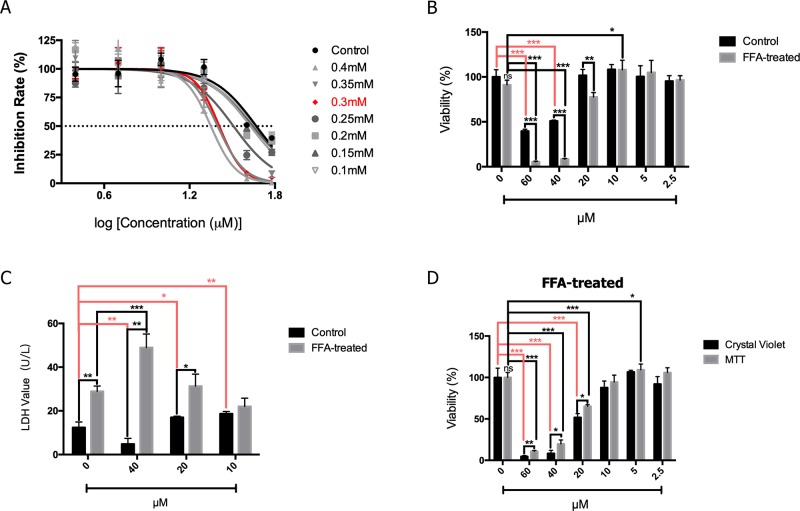
Figure 3.
2′-HC exacerbated damage in the lipid-loaded hepatocytes. (A) Inhibitory effects of different concentrations of 2′-HC treated with FFA. (B) Effects of different concentrations of 2′-HC on cell viability. (C) Effects of different concentrations of 2′-HC on the LDH level. (D) Different methods for detecting cell viability. The data are shown as the mean ± SD, *p < 0.05, **p < 0.01, ***p < 0.001.

