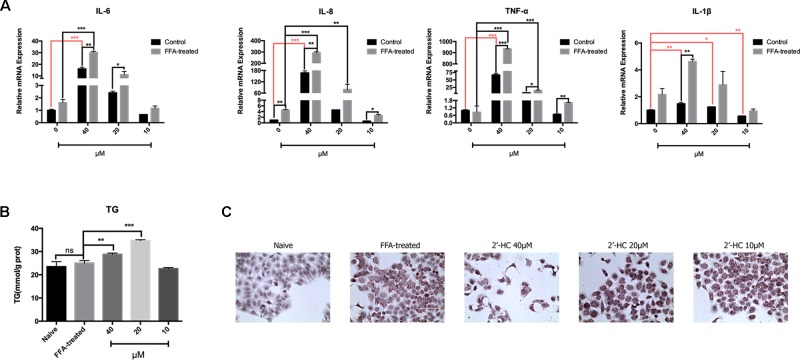
Figure 7.
2′-HC aggravated inflammation and lipid stress in the lipid-loaded hepatocytes. (A) Effects of different concentrations of 2′-HC on the cytokines. (B) Effects of different concentrations of 2′-HC on TG. (C) Effects of different concentrations of 2′-HC on lipid droplet formation by Oil Red O staining. The data are shown as the mean ± SD, *p < 0.05, **p < 0.01, ***p < 0.001. ns, no statistical difference.

