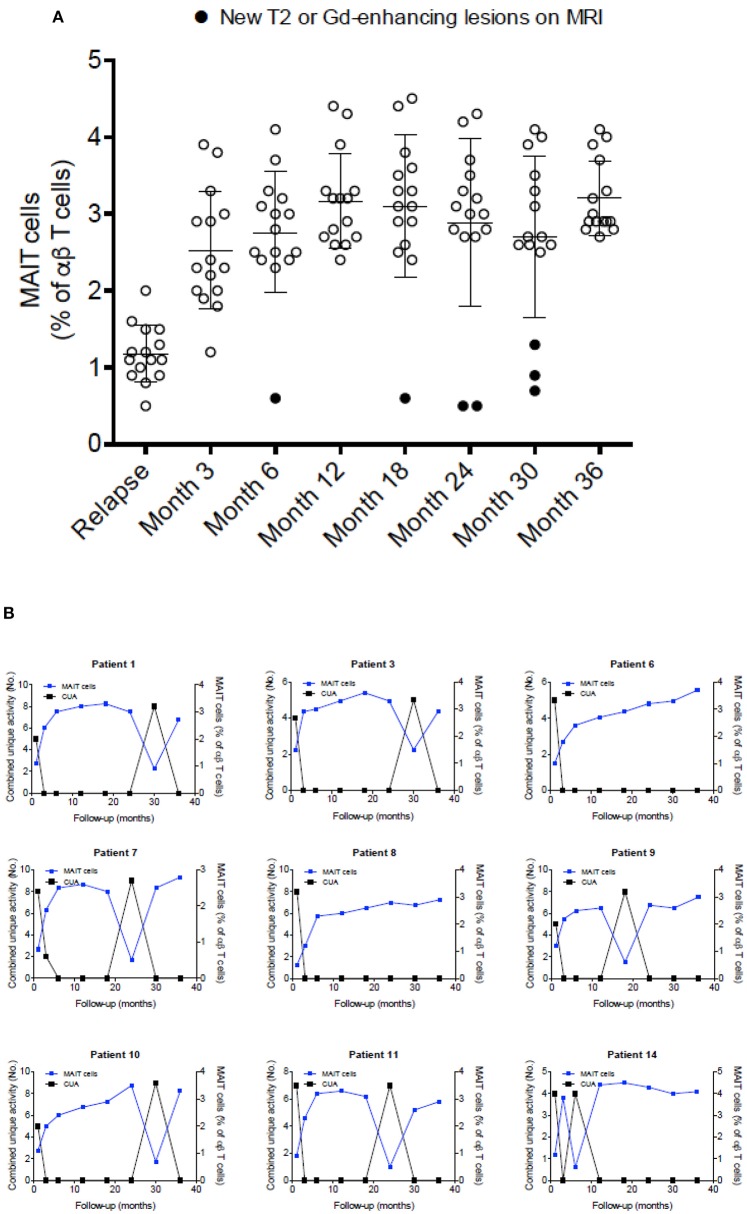
Figure 4.
MAIT cell percentages were related to disease activity. (A) After a clinical relapse and during follow-up (3–36 months), MAIT cell numbers were significantly increased, in parallel with clinical recovery, with high values persisting while disease remained stable. Each symbol represents values from single individuals (n = 15) and the middle line represents the mean. (B) During follow-up, seven patients examined at 6, 18, 24, and 30 months showed further decline in MAIT cell numbers (patients numbers 1, 3, 7, 9, 10, 11, and 14), while simultaneously showing disease-related MRI activity (A, closed circles), evidenced as new or enlarging T2 lesion and/or Gd-enhancing lesions on brain MRI screening; i.e., inverse correlation was observed between MAIT cell percentage and presence of new or enlarging T2 lesions, Gd-enhancing lesions, or CUA score. In contrast, in MS patients in whom MAIT cell numbers remained elevated during follow-up, there was no evidence of new MRI activity (patients 6 and 8). All patients studied received IFN-β 1a treatment from the beginning of the study was seen. CUA: combined unique activity was calculated by adding new or enlarging T2 lesions to gadolinium-enhancing lesion. Correlations were performed using Spearman's correlation analysis.

