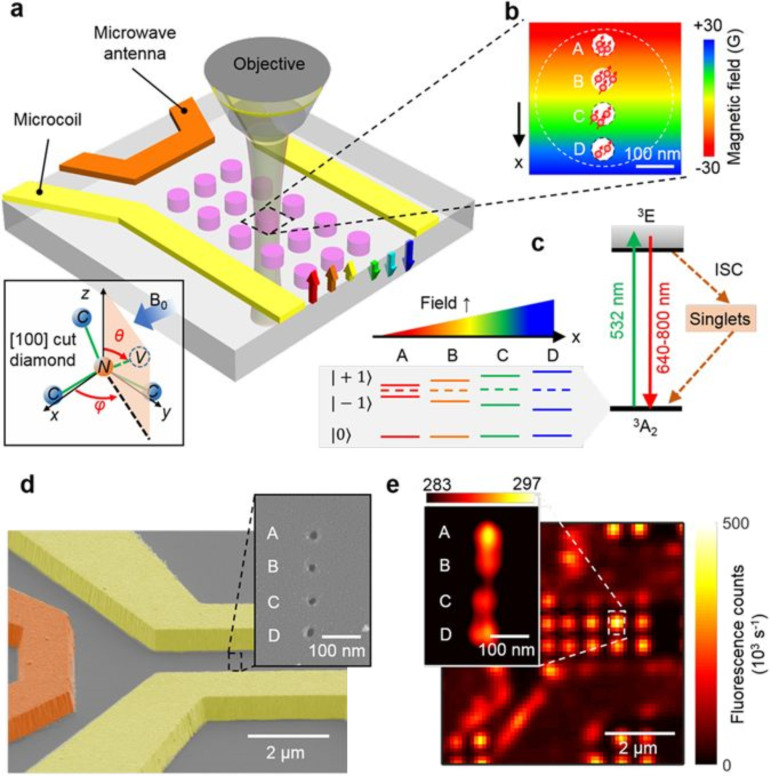
Figure 2.
Experimental set-up and characterization of NV centers and the gradient microcoil of [43]. Image reproduced with permission from [43], an article licensed under a Creative Commons Attribution 4.0 International License, https://creativecommons.org/licenses/by/4.0/. (A) Experimental apparatus. A matrix of implantation regions (pink circles) of negative charge NV centers on the diamond is integrated into a scanning confocal microscope. A green laser (532 nm) is used to initialize and read out NV center spin states in a given region and microwaves emitted by an antenna (orange bar) manipulate them. A uniform magnetic bias field of B0 = 128 G is applied along one range of NV orientations, causing a Zeeman line splitting among |±1⟩ NV center spin states; without a magnetic field they would show a 2.87 GHz frequency shift from the |0⟩ state. An added gradient magnetic field (rainbow-colored arrows) of ≈0.1 G·nm−1 is applied by injecting current along a pair of gold wires (gradient microcoil), inducing the Zeeman shift depending on the position. (B) Each region (pink circle in a) holds a 1 × 4 array of NV sites with 60 nm diameter and 100 nm spacing, which undergo interaction that depends on the gradient in the magnetic field. Each site typically holds multiple (≈3 ± 1) NVs of the selected orientation. (C) NV energy-level diagram. A nonradiative intersystem crossing channel exists between the ground (3A2) and excited (3E) states, and the magnetic field gradient causes the NV center spin states |±1⟩ Zeeman splitting to be dependent on their position. Each site has a specific resonance that the microwave generator can be tuned to, allowing for selective detection of each site. (D) Gradient microcoil SEM image on the diamond substrate. The microcoil, represented by yellow pseudo-color, is 1 µm thick and 2 µm wide. (Inset) E-beam resist apertures on PMMA, SEM image of ion implantation mask to create a 1 × 4 array of NV sites. (E) Microcoil and NV center matrix image by scanning confocal microscopy. (Inset) STED image of 1 × 4 array of NV sites with 50 nm resolution. Photon count rate (kilo-counts-per-second) is shown by color table.

