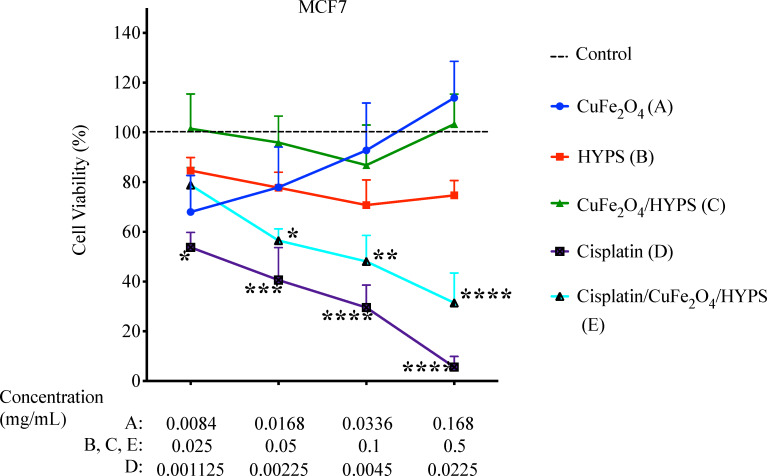
Figure 8.
Percentage cell viability using MTT assay on the MCF-7 cell line. The cells were treated with the following formulations for 48 h: CuFe2O4 (A), HYPS (B), CuFe2O4/HYPS (C), cisplatin (D), and cisplatin/CuFe2O4/HYPS (E). The treatment concentrations used were as indicated in the figure. The reason for the different concentrations of CuFe2O4 and cisplatin is because they correspond to the amount adsorbed on the cisplatin/CuFe2O4/HYPS nanoparticles. For details, please see the Materials and Methods section. n = 4 independent experiments. Dashed line represents untreated control. Error bars ± standard error of the mean (SEM) and * p < 0.05; ** p < 0.01; *** p < 0.001; **** p < 0.0001 versus control.

