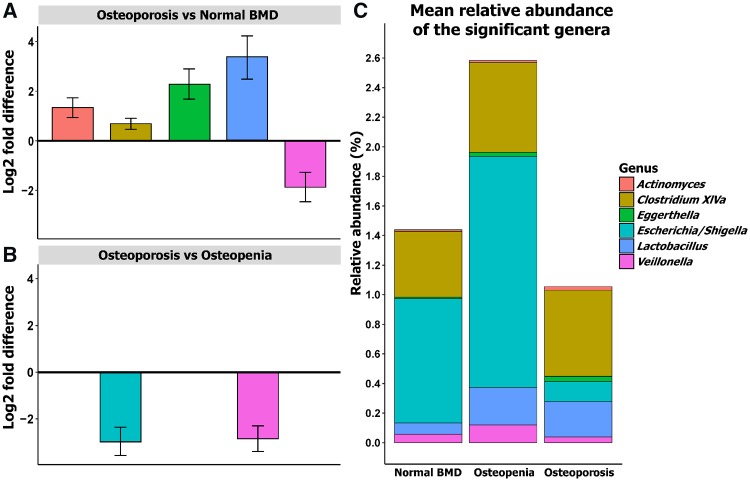
Fig. 3.
Taxa with differential abundance across the BMD groups
Plot of the log2-fold difference from the significantly differentially abundant genera in pairwise analysis between the groups from the DESeq2 analysis when the model is adjusted for BMI and gender. Based on the log2-fold difference, (A) shows the genera that are significantly higher in osteoporosis compared with normal BMD, (B) represents the genera that are significantly more abundant in osteoporosis compared with osteopenia and (C) represents the relative abundance of the significant genera in the three groups identified in DESeq2.

