
Fig. 13.
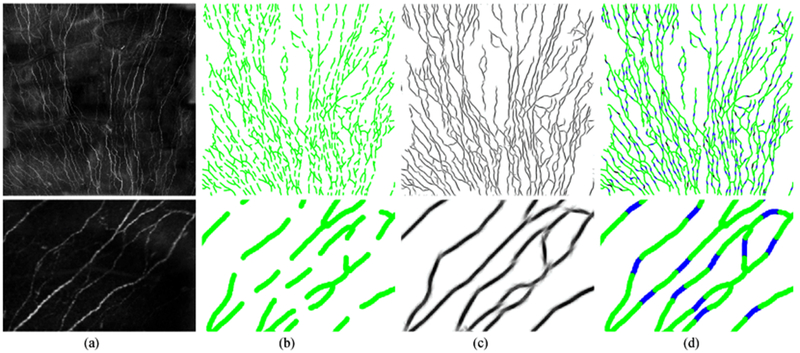
Examples of applying the proposed reconnection method on the interrupted corneal nerve fiber skeletons (1536 × 1536). (a) Row 1: the original images with clipped empty boundaries, and Row 2: a zoomed patch (220 × 320) for better visualization; (b) the broken vessel skeleton map with gap size λ = 31 × 31; (c) the 2D projection after applying the proposed reconnection method in orientation scores; (d) the reconnection performance maps, where green represents the original structures, blue indicates the correctly recovered gaps, red means the false positives and black gives the missing connections.