
Fig. 6.
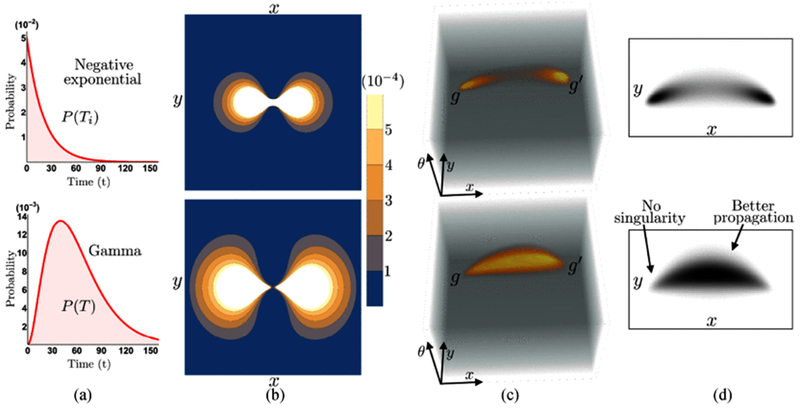
Examples of the completion process in SE(2) via time integration with negative exponential distribution (Row 1) and Gamma distribution (Row 2). Column (a) presents the negative exponential distribution with α = 0.05 and Gamma distribution with α = 0.05 and k = 3, Column (b) shows the contour plots of the 2D projection of the explicit completion kernel. Column (c) gives the 3D “ink propagation” for filling the gaps between two group elements and , where the Gamma distribution gives better propagation and avoids singularities at the origin as shown in (d).