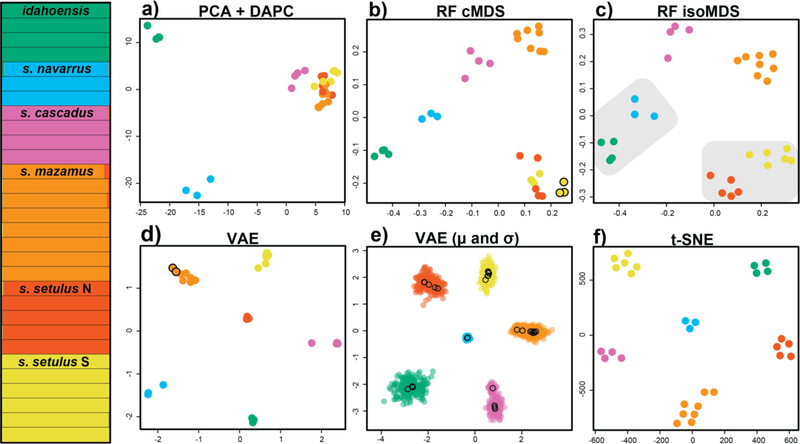
Figure 2.
Clustering results for the Metanonychus setulus complex based on 70% SNP dataset. (Left) STRUCTURE plot. a) PCA plot with DAPC clusters. b) random forest cMDS plot, all clustering algorithms favored K=6, except hierarchical clustering with K=7 (seventh cluster indicated with black outline). c) random forest isoMDS plot, all clustering algorithms favored K=6, except PAM clustering of RF output with K=4 (lumped clusters indicated with grey shading). d) VAE plot, all clustering algorithms favored K=6, except hierarchical clustering with K=7 (seventh cluster indicated with black outline). e) VAE results with encoded mean (μ – open circles) and standard deviation (σ – closed circles) for each sample. f) t-SNE plot, all clustering algorithms favored K=6.

