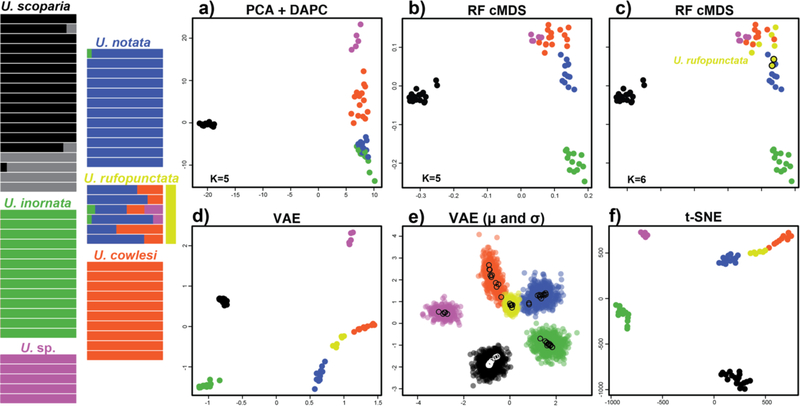
Figure 4.
Clustering results for Uma dataset. STRUCTURE plot at left adapted from Gottscho et al. (2017). a) PCA with DAPC clusters. b) random forest cMDS plot with clusters identified via DAPC, PAM, and gap statistic. c) random forest cMDS plot with clusters identified via hierarchical clustering. d) VAE plot with K=6 a priori species. e) VAE results with encoded mean (μ – open circles) and standard deviation (σ – closed circles) for each sample. f) t-SNE plot with K=6 a priori species. Species are color coded as in Gottscho et al. (2017). Note: algorithmic clustering was only conducted on random forest output.

