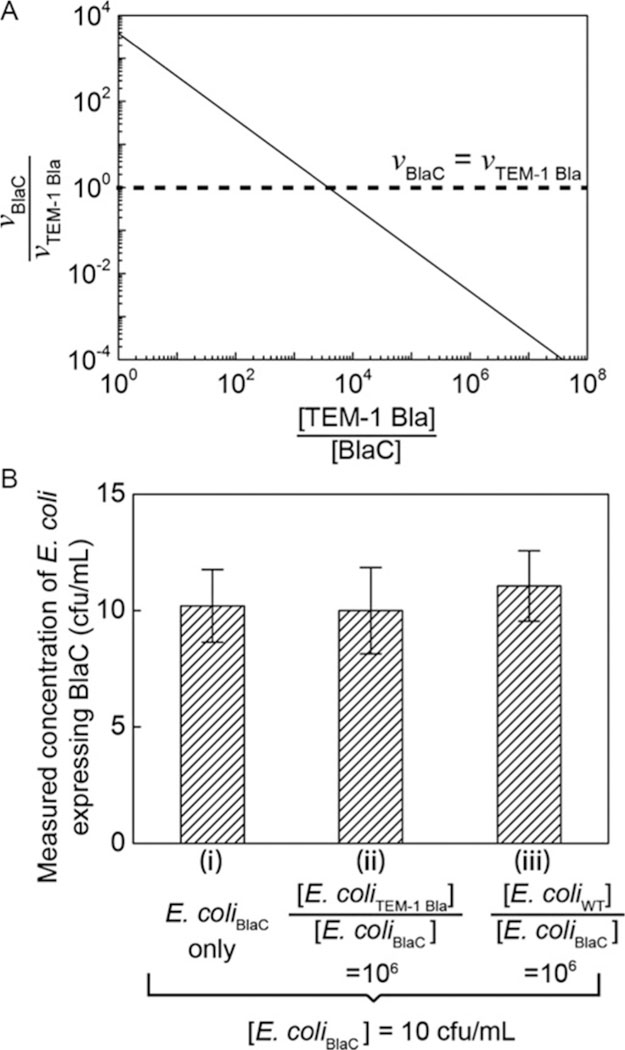
FIG. 4.
(A) The calculated ratio of fluorescence turn-on rate of probe CDG-OMe by BlaC (vBlaC) and by TEM-1 Bla (vTEM-1 Bla), when BlaC and TEM-1 Bla are mixed at different ratios ([TEM-1 Bla]/[BlaC]). When [TEM-1 Bla]/[BlaC] ~ 103, the turn-on rate of CDG-OMe by BlaC equals that by TEM-1 Bla. The graph is calculated based on kinetic parameters of CDG-OMe by BlaC and TEM-1 Bla, respectively. (B) Measured concentration of E. coli expressing BlaC using droplet microfluidics in three separate experiments: (i) 10cfu/mL E. coli expressing BlaC (“E. coliBlaC”) in MES buffer, (ii) 10cfu/mL E. coli expressing BlaC mixed with 107cfu/mL E. coli expressing TEM-1 Bla (“E. coliTEM-1 Bla”), and (iii) 10cfu/mL E. coli expressing BlaC mixed with 107cfu/mL wild-type E. coli (“E. coliWT”). The height of each bar represents the mean concentration collected from at least three experiments. The height of the error bars represents one standard deviation from the mean.

