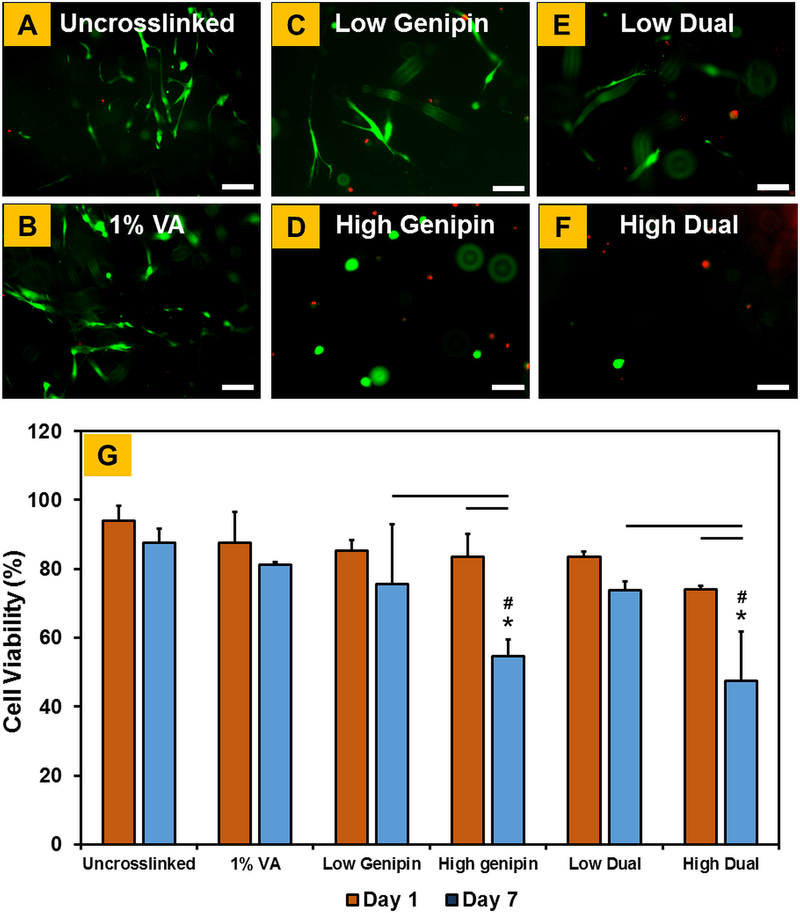
Figure 6.
(A-F) Live-dead assay to assess the viability of hMSCs encapsulated within crosslinked CMA hydrogels (live cells stain green and dead cells stain red). (G) Quantification of cell viability plot (* denotes p < 0.05 when comparing crosslinked CMA with uncrosslinked CMA, # denotes p < 0.05 when comparing between other crosslinked CMA with 1% VA-086 crosslinked CMA, horizontal lines denote p < 0.05 between connecting groups). Scale bar: 100μm

