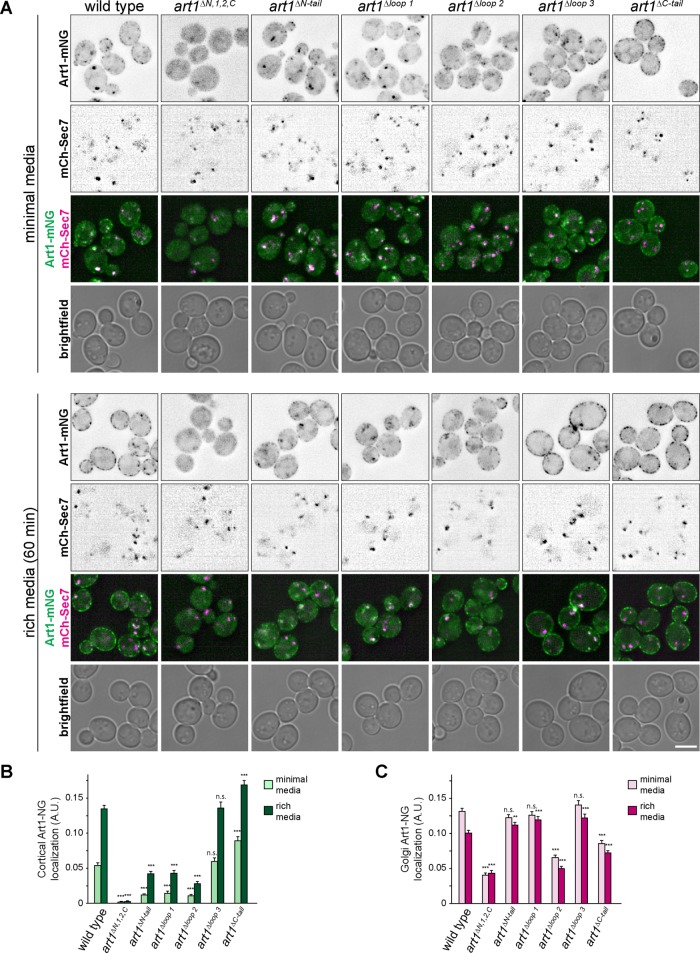
FIGURE 3:
Localization of Art1 loop and tail mutants. (A) Localization of the indicated Art1-mNG loop and tail mutants in minimal media and after shifting to rich media for 60 min. Scale bar = 2 µm. (B) Quantification of PM localization of the indicated Art1 loop and tail mutants. (C) Quantification of Golgi localization of the indicated Art1 loop and tail mutants. Bars indicate 95% CI, n > 400 cells for each condition. ***, p < 0.001; **, p < 0.01 vs. WT at matched treatment.

