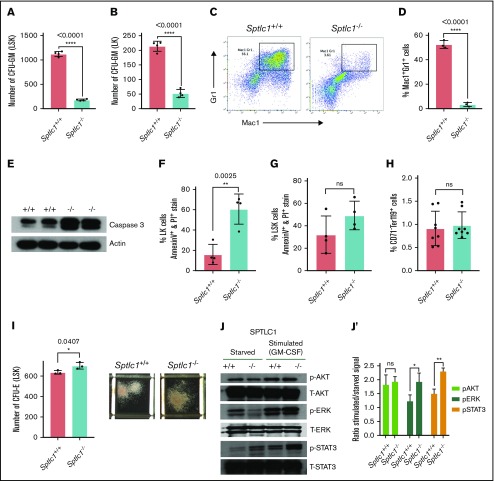
Figure 5.
Myeloid differentiation defects in Sptlc1−/−BMCs. In vitro culture. (A-B) The total numbers of CFUs for Sptlc1+/+ and Sptlc1−/− FACS-sorted LK and LSK cells. The results are from 4 Sptlc1+/+ and 4 Sptlc1−/− mice. (C) Sptlc1+/+ and Sptlc1−/− Lin− cells were induced to differentiate in liquid culture with medium containing GM-CSF and IL-3. After 4 days, cells were stained for Mac-1 and Gr-1. The results are from 3 Sptlc1+/+ and 3 Sptlc1−/− mice. (D) The percentage of Mac-1+Gr-1+ cells was plotted for Sptlc1+/+ and Sptlc1−/−. (E) Western blot analysis of cell extracts from BMCs cultured in the presence of GM-CSF and IL-3 for 4 days. Sptlc1+/+ and Sptlc1−/− lysates were probed for caspase 3. (F) The percentages of LK cells staining positive for annexin V and PI were plotted for 4 Sptlc1+/+ and 4 Sptlc1−/− 21 days after poly(I:C) injection. (G) The percentages of LSK cells staining positive for annexin V and PI were plotted for 4 Sptlc1+/+ and 4 Sptlc1−/− 21 days after poly(I:C) injection. (H) The percentage of CD71−Ter119+ cells was plotted for Sptlc1+/+ and Sptlc1−/− cells. (I) The total numbers of CFU-E for Sptlc1+/+ and Sptlc1−/− FACS-sorted LSK cells. The results are from technical triplicates of samples from 3 Sptlc1+/+ and 3 Sptlc1−/− mice. Representative photographs of LSKs differentiating into erythroid colonies taken after 10 days of solid culture (bright field microscopy; original magnification ×2). (J) Lin− cells isolated from Sptlc1+/+ and Sptlc1−/− mice cultured in the presence of mSCF and IL-3 for 3 days, serum starved for 3 hours followed by stimulated with GM-CSF (50 ng/mL) for 10 minutes at 37°C. Western blots for p-AKT, p-ERK1/2, and p-STAT3 and their respective dephosphorylated forms. Data representative of 3 independent experiments. (J′) Quantitative data representative of 3 independent experiments. All graphs are represented as mean ± SEM. P < .05 is significant, calculated from the unpaired Student t test.

