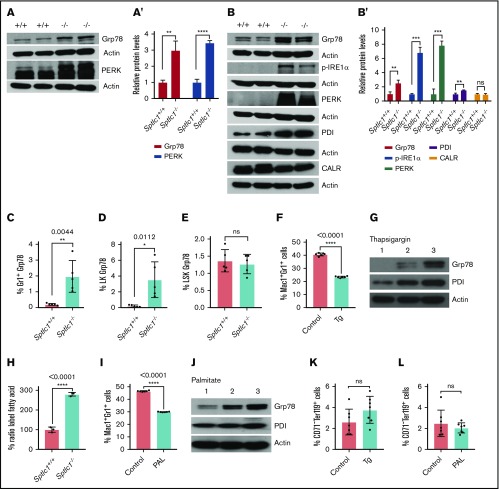
Figure 6.
Sptlc1−/−BMCs exhibit ER stress that compromises myeloid differentiation. (A) Western blot analysis of Sptlc1+/+ and Sptlc1−/− BM cells harvested 3 days after poly(I:C) injection. Lysates were probed for Grp78 and PERK. Cleaved PERK products were detectable in the Sptlc1−/−. (A′) Quantitative data representative of 3 independent experiments. (B) Western blot analysis of cell extracts of Sptlc1+/+ and Sptlc1−/− BMCs cultured for 4 days in the presence of GM-CSF and IL-3. Lysates were probed for Grp78, p-IRE1α, PERK, PDI, and calreticulin. (B′) Quantitative data representative of 3 independent experiments. (C-E) The Grp78 (BiP) staining of Gr1, LK, and LSK cells was plotted for 5 Sptlc1+/+ and 5 Sptlc1−/− BMT mice, analyzed 4 days after poly(I:C) injection (n = 5). (F) The wild-type BM cells were cultured in the presence of GM-CSF and IL-3 factors in liquid culture with dimethyl sulfoxide (DMSO) (control) and Tg (10 nM) for 2 days and stained for Mac-1 and Gr-1. The percentage of Mac-1+Gr-1+ cells was plotted for control and Tg-treated cells (n = 6). (G) Western blot analysis of Grp78 and PDI for lysates from control and Tg-treated cells. Lanes: 1, nucleated BMCs (before culture); 2, control; and 3, Tg-treated cells. (H) The percentages of radiolabeled fatty acids were plotted for the Sptlc1+/+ and Sptlc1−/−. (I) Wild-type BM cells were cultured in the presence of GM-CSF and IL-3 with bovine serum albumin (BSA) (control) and with sodium palmitate (200 μM) for 4 days. The cells were stained for Mac-1 and Gr-1. The percentage of Mac-1+Gr-1+ cells was plotted for control and palmitate-treated cells (n = 6). (J) Western blots of Grp78 and PDI for lysates of control and palmitate-treated cells. Lanes: 1, nucleated BMCs; 2, control; and 3, palmitate-treated cells. (K) The percentage of CD71−Ter119+ cells was plotted for control and Tg-treated cells (n = 7). (L) The percentage of CD71−Ter119+ cells was plotted for control and palmitate-treated cells (n = 7). All graphs are represented as mean ± SEM. P < .05 is significant, calculated from the unpaired Student t test.

