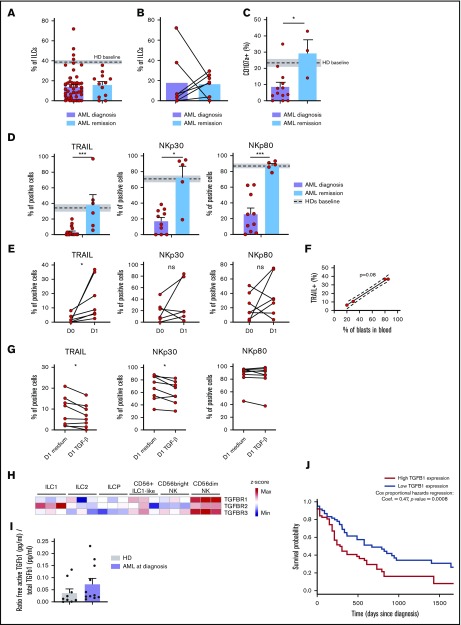
Figure 5.
CD56+ILC1-like cell cytotoxicity is restored in AML patients during remission and is modulated by blasts and TGF-β1. (A) Comparison of peripheral blood (PB) CD56+ ILC1-like cell relative frequencies in AML patients at diagnosis and during remission (n = 12). (B) Comparison of PB CD56+ ILC1-like cell frequencies in paired AML patient samples at diagnosis and during remission (n = 7). (C) Comparison of CD56+ ILC1-like cell AML patients at diagnosis or during remission to determine the degranulation capacity after a 4-hour coculture of ILC/NK-enriched PBMCs with K562 (ratio E:T 1:1), anti-CD107a, and Golgistop (remission: n = 3). (D) Comparison of TRAIL, NKp30, and NKp80 expression in PB CD56+ ILC1-like cells from AML patients at diagnosis (n = 10) and during remission (n = 5). (E-F) PBMCs from AML patients at diagnosis were depleted of CD33+ blasts and cultured for 24 hours in complete medium. (E) Extracellular flow cytometry was performed to assess TRAIL, NKp30, and NKp80 expression in CD56+ ILC1-like cells (n = 6-7). Correlation between TRAIL expression after the 24 h culture and blast frequencies in PB (n = 4, panel F). (G) PBMCs from HDs were enriched in ILC/NK cells and cultured for 24 hours with medium only or supplemented with rhTGF-β1 at 5 ng/mL (n = 8). TRAIL, NKp30, and NKp80 expression was assessed by flow cytometry after the culture. (H) Heat map of z scores of expression levels of genes encoding TGF-β receptors in ILCs and cNKs (n = 3). (I) Free/total TGF-β1 ratio in sera from HDs and AML patients. Sera with concentrations above the limit of detection of the assay are shown (HDs: n = 9, AML patients: n = 11). (J) Kaplan-Meier overall survival analysis based on TGF-β1 expression in AML patients from The Cancer Genome Atlas program (TCGA) (n = 125). We excluded patients presenting a t(15;17) translocation (ie, patients with acute promyelocytic leukemia as classified according to the 2017 European LeukemiaNet recommendations36) from our analysis since this condition represents a distinct AML pathophysiological entity. Statistical tests used: panels C-D: Mann-Whitney unpaired U test; panels E,G: Wilcoxon paired t test; panel F: Spearman correlation; panel J: difference in overall survival (OS) between AML patients with high (n = 64) or low (n = 61) TGF-β1 expression based on TCGA data. *P < .05, ***P < .001.

