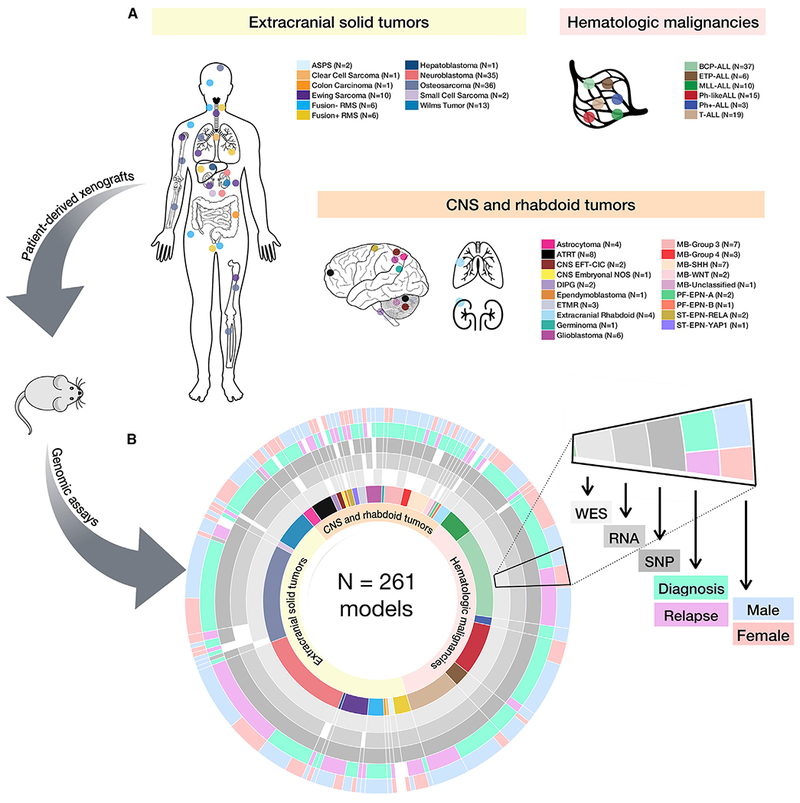
Figure 1. Study and Sample Overview.

(A and B) Diversity of the 261 childhood tumors collected (A) and demographics and genomic assays performed by histology (B). Assays performed were whole-exome sequencing (n = 240), whole transcriptome (n = 244), and SNP array copy number analysis (n = 252). Each genomic assay was performed once per biological tumor sample.
See Figure S1 for analysis pipelines, Table S1 for model metadata, and Table S2 for STR profiles.
