
Figure 2. PDX Models Recapitulate the Mutational Landscape of Childhood Cancers.
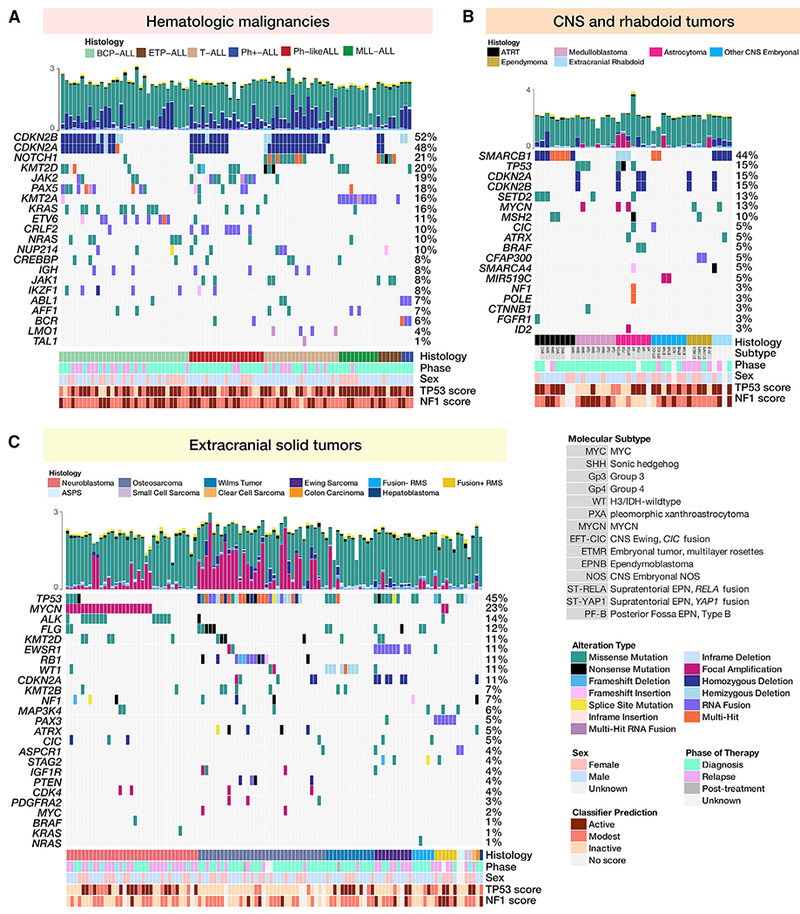
(A–C) Oncoprints of somatic alterations (homozygous deletions, amplifications, SNVs, and fusions) in hallmark driver genes for PDX models for which exome sequencing was performed (n = 240, top 20 genes per histology shown). Oncoprints are grouped by acute lymphoblastic leukemias (A), CNS and rhabdoid tumors (B) and extracranial solid tumors (C).
(A) From left to right are B cell precursor ALLs (n = 33), T cell ALLs (n = 25), Philadelphia chromosome positive (Ph+) ALLs (n = 3), mixed lineage leukemias (MLL, n = 10), early T cell precursor (ETP) ALLs (n = 6), and Philadelphia chromosome-like (Ph-like) ALLs (n = 19).
(B) From left to right are atypical teratoid rhabdoid tumors (ATRTs; n = 8), medulloblastomas (MBs; n = 8), astrocytomas (n = 7), non-MB/non-ATRT CNS embryonal tumors (n = 7), ependymomas (n = 5), and extracranial rhabdoid tumors (n = 4).
(C) From left to right are neuroblastomas (n = 35), osteosarcomas (n = 34), Wilms tumors (n = 13), Ewing sarcomas (n = 10), fusion negative rhabdomyosarcomas (n = 6), fusion positive rhabdomyosarcomas (n = 6), and rare solid tumors (n = 7). Clinical annotations for all models include histology, patient phase of therapy from which PDX was derived, and sex. CNS tumors were also annotated with molecular subtype. Hemizygous deletions in TP53 are annotated for osteosarcoma models, in CDKN2A for leukemia models, and in WT1 for Wilms tumor models. Focal homozygous deletions correspond to loss of expression (FPKM < 1) in models for which RNA was available. For fusions, only the 5′ partner is shown. Total mutations (log 10) per model are plotted above each oncoprint and colored by mutation type. Each genomic assay was performed once per biological tumor sample.