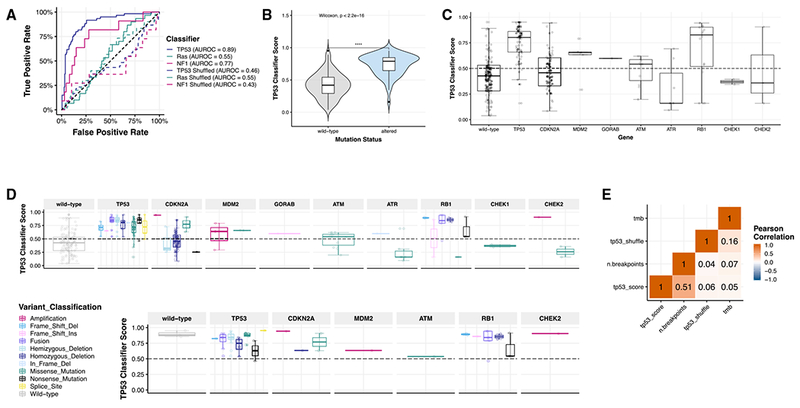
Figure 4. Expression and Mutational Signatures Classify Pediatric PDX Models for TP53 and NF1 Inactivation.

(A) Only TP53 and NF1 classifiers performed well in our dataset (AUROCTP53 = 0.89, AUROCNF1 = 0.77, AUROCRas = 0.55). Solid lines represent real scores, and dotted lines represent shuffled scores. Forthe samples measured (n = 244), 60 had TP53 alterations (24.6%); 30 had KRAS, HRAS, or NRAS alterations (12.3%); and 11 had NF1 alterations (4.5%).
(B) TP53 scores are significantly higher (nWT = 120, nALT = 124, Wilcoxon p < 2.2 e–16) in models with genetic aberrations in TP53 (mean score = 0.790) compared to those without alterations (mean score = 0.419).
(C) Classifier scores are plotted based on the TP53 pathway gene alteration present (nWT = 120, nTP53 = 72, nCDKN2A = 63, nMDM2 = 5, nGORAB = 1, nATM = 11, nATR = 7, nRB1 = 16, nCHEK1 = 2, nCHEK2 = 3) or variant classification (n = 244 total samples).
(D) TP53 classifier scores across all histologies broken down by TP53 pathway gene (n = 240).
(E) In osteosarcoma models (n = 30), all scores, regardless of variant type or gene, were high and predicted pathway inactivation. Overall copy number burden (number of breakpoints calculated from SNP array data; STAR Methods) correlates significantly with TP53 classifier score (R = 0.51, p = 1.8e–17, n = 239). All n’s denote biological replicates.
